See When Market Momentum Starts Fading
Momentum exhaustion
What TRI Indicator Does
TRI is a visual momentum oscillator designed to highlight potential exhaustion phases within trends.
The Trend Reversal Indicator (TRI) is a visual analytical tool that highlights momentum transitions inside trending markets.
Instead of predicting exact reversal points, TRI focuses on showing when directional pressure begins to weaken.
- →Highlights potential momentum exhaustion
- →Adds visual context to chart analysis
- →Supports discretionary trading workflows
- →Works across multiple timeframes
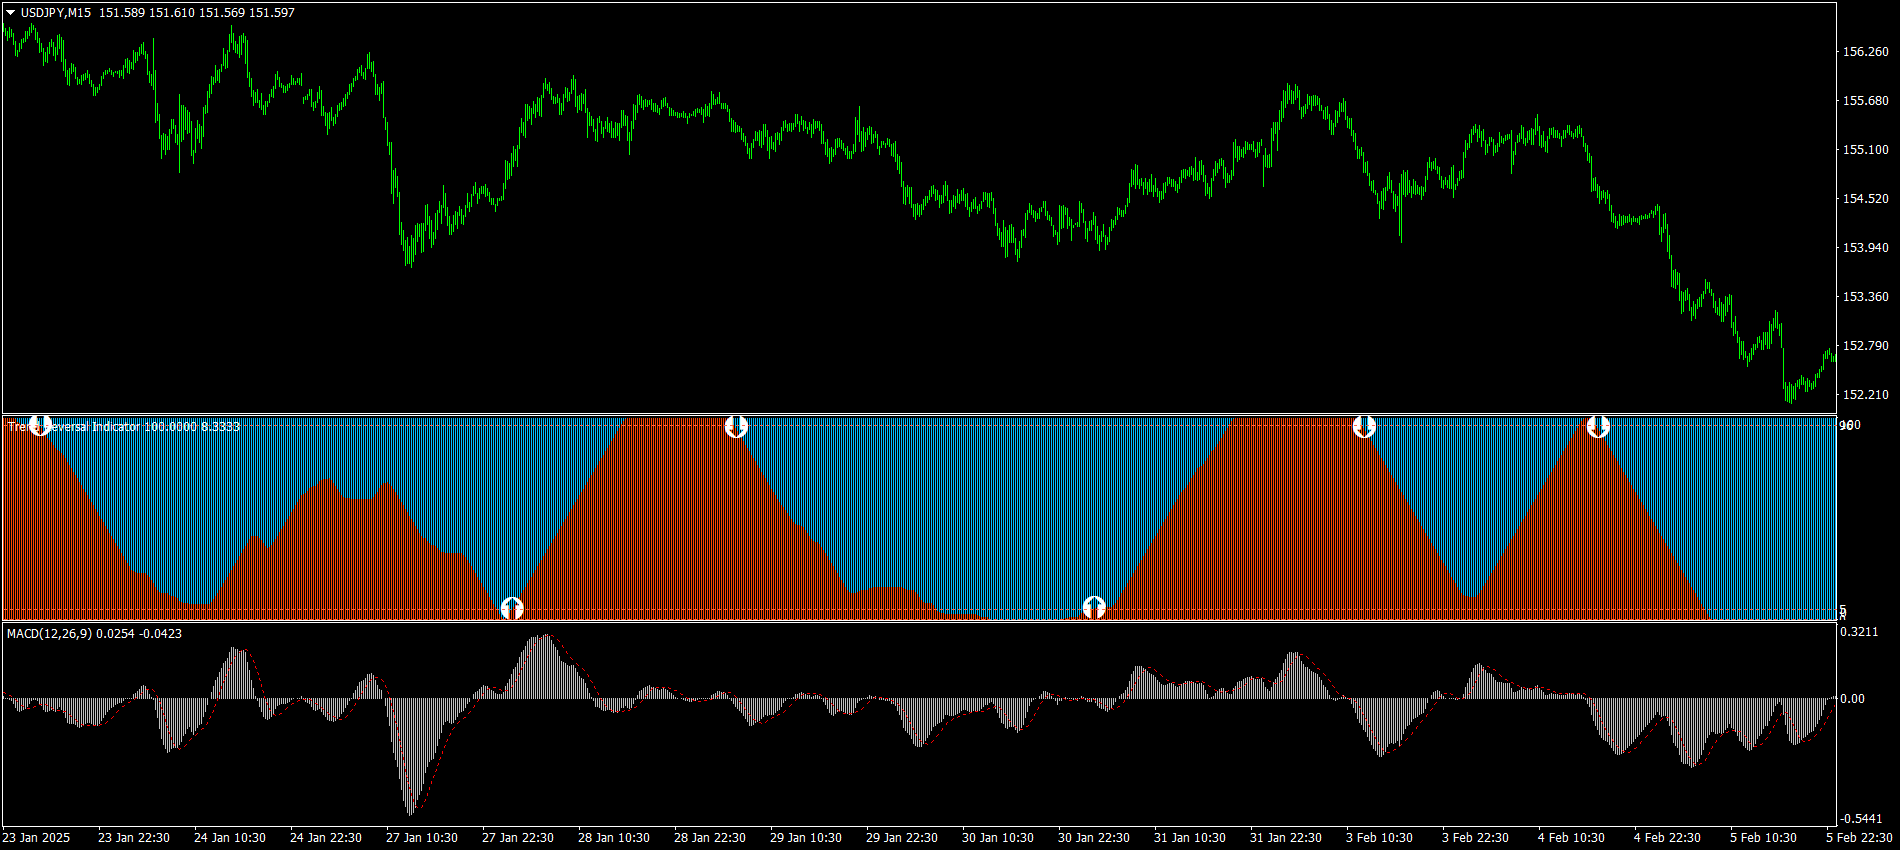
Momentum Shifts on Real Charts
Example: TRI momentum exhaustion zones appearing before trend slowdowns.
Why Timing Is Difficult In Trading
Many traders spend years learning strategies and technical patterns.
However, markets often remain extended longer than expected. Without additional context, traders may enter too early or hesitate during key moments.
Structured momentum analysis can help provide additional perspective when evaluating market conditions.
Why Traditional Oscillators Often Lack Context
Traditional oscillators were designed to identify overbought or oversold conditions.
Modern markets often remain extended while momentum gradually shifts — making it difficult to rely solely on static thresholds.
TRI focuses on visualizing momentum transitions instead of attempting to predict exact reversal points.
Real Charts. Real Signals. No Guessing.
This example demonstrates how TRI visualizes gradual momentum transitions within real market structure.
Try TRI Indicator
Simple analytical tool for visualizing momentum shifts.
Get TRI for $27One-time access • No subscription
How Traders Use TRI
TRI complements existing chart analysis by providing structured visual context around momentum transitions and potential exhaustion phases.
Trusted by Traders Worldwide
Feedback from traders across forex, crypto and index markets. Results vary; TRI is an analytical tool, not a trading system.
★★★★★“Provides helpful visual context during extended trends. I use it as part of my regular chart workflow alongside my existing analysis.”
★★★★★“Helpful visual context during extended trends. Makes it straightforward to spot potential momentum shifts without overcomplicating the chart.”
★★★★★“The neutral mode is well designed — it stays quiet when conditions are unclear. A clean additional context layer for my discretionary analysis.”
★★★★★“Before using TRI, I kept entering late and getting stopped out. Now I wait for the zone and use TRI as an additional reference. 10+ years of trading — this indicator helps keep my analysis more structured. I now spot potential momentum shifts earlier than I did relying on MACD or RSI alone.”
★★★★★“Works great on MT4. The position size calculator is a useful bonus — and TRI itself gives me better visual context when I’m assessing trend structure. Simple to set up.”
Past performance is not indicative of future results. TRI is an analytical tool, not a trading system.
What Changes When Timing Becomes Clear
When traders see structure earlier, decisions become simpler. The goal isn’t more signals — it’s better timing context.
- Fewer late entries
- Clearer invalidation levels
- More patience between trades
That is exactly what TRI was built for.
Simple One-Time Access • No Subscription
Entry-Level Access to TRI Indicator
One-time purchase. No subscription. No recurring payments.
One-time purchase
No subscription
- Instant download after checkout
- Works across multiple markets
- Designed for discretionary traders
- PDF installation guide included
Choose your platform
Trading financial markets involves risk.
TRI is an analytical tool designed to support independent chart analysis.
🔒 Secure checkout • Instant access • No subscription
Instant download after checkout • Works on TradingView & MetaTrader MT4/MT5
Secure Stripe checkout · Instant delivery · No subscriptions
Need help after purchase? Email support — we’ll guide you through setup.

Safe and secure payments — no automatic charges, ever.
Many analytical tools require monthly subscriptions or significantly higher pricing. TRI is offered as a lightweight one-time purchase for traders who want to experiment with structured timing analysis.
Everything You Need to Know Before Checkout
You get lifetime access to the Trend Reversal Indicator for MetaTrader (MT4/MT5) or TradingView, including all future updates and support. Also included: PDF installation guide and email support for setup.
No. TRI is a visual analytical indicator. You stay in full control — it provides chart context to support your own discretionary decisions. Positions do not open automatically.
No. TRI is an analytical indicator that visualizes potential momentum transitions. It does not generate automated trading signals.
No. TRI is an analytical tool intended to support independent market analysis. It should not be interpreted as financial or investment advice.
TRI works across Forex, Stocks, Indices, and Crypto — on all timeframes from M1 to MN, available for MetaTrader (MT4/MT5) and TradingView.
Within 30 minutes of payment — usually sooner. You will receive a PDF guide and installation support if needed.
Certainly. Send us a message through our contact form with your preferred payment method, and we will provide the necessary information.
Risk Disclosure
Trading financial markets involves risk. The TRI indicator is an analytical tool intended to support independent chart analysis. It does not guarantee profits and should not be interpreted as financial advice.
MQL Software — building analysis tools since 2010
Founded in 2010, MQL Software builds professional-grade trading analysis tools used by 10,000+ traders worldwide.
TRI is one of our analytical tools — designed to give traders better timing context. Lifetime updates and support included.
Learn more about MQL Software →Get TRI Indicator Access
Available for MetaTrader and TradingView.
Get TRI IndicatorInstant access after checkout