Checking the Daily or Weekly candle usually means leaving the chart you’re actually trading — flip to a higher timeframe, read it, flip back, and hope you remembered it right. HTF Candle Architecture — a free, open-source TradingView overlay by MQLSoftware — draws up to three higher-timeframe candles directly on your current chart instead, live and growing bar by bar, so the context is on screen the whole time instead of one tab-switch away.
Three candles, one chart, live
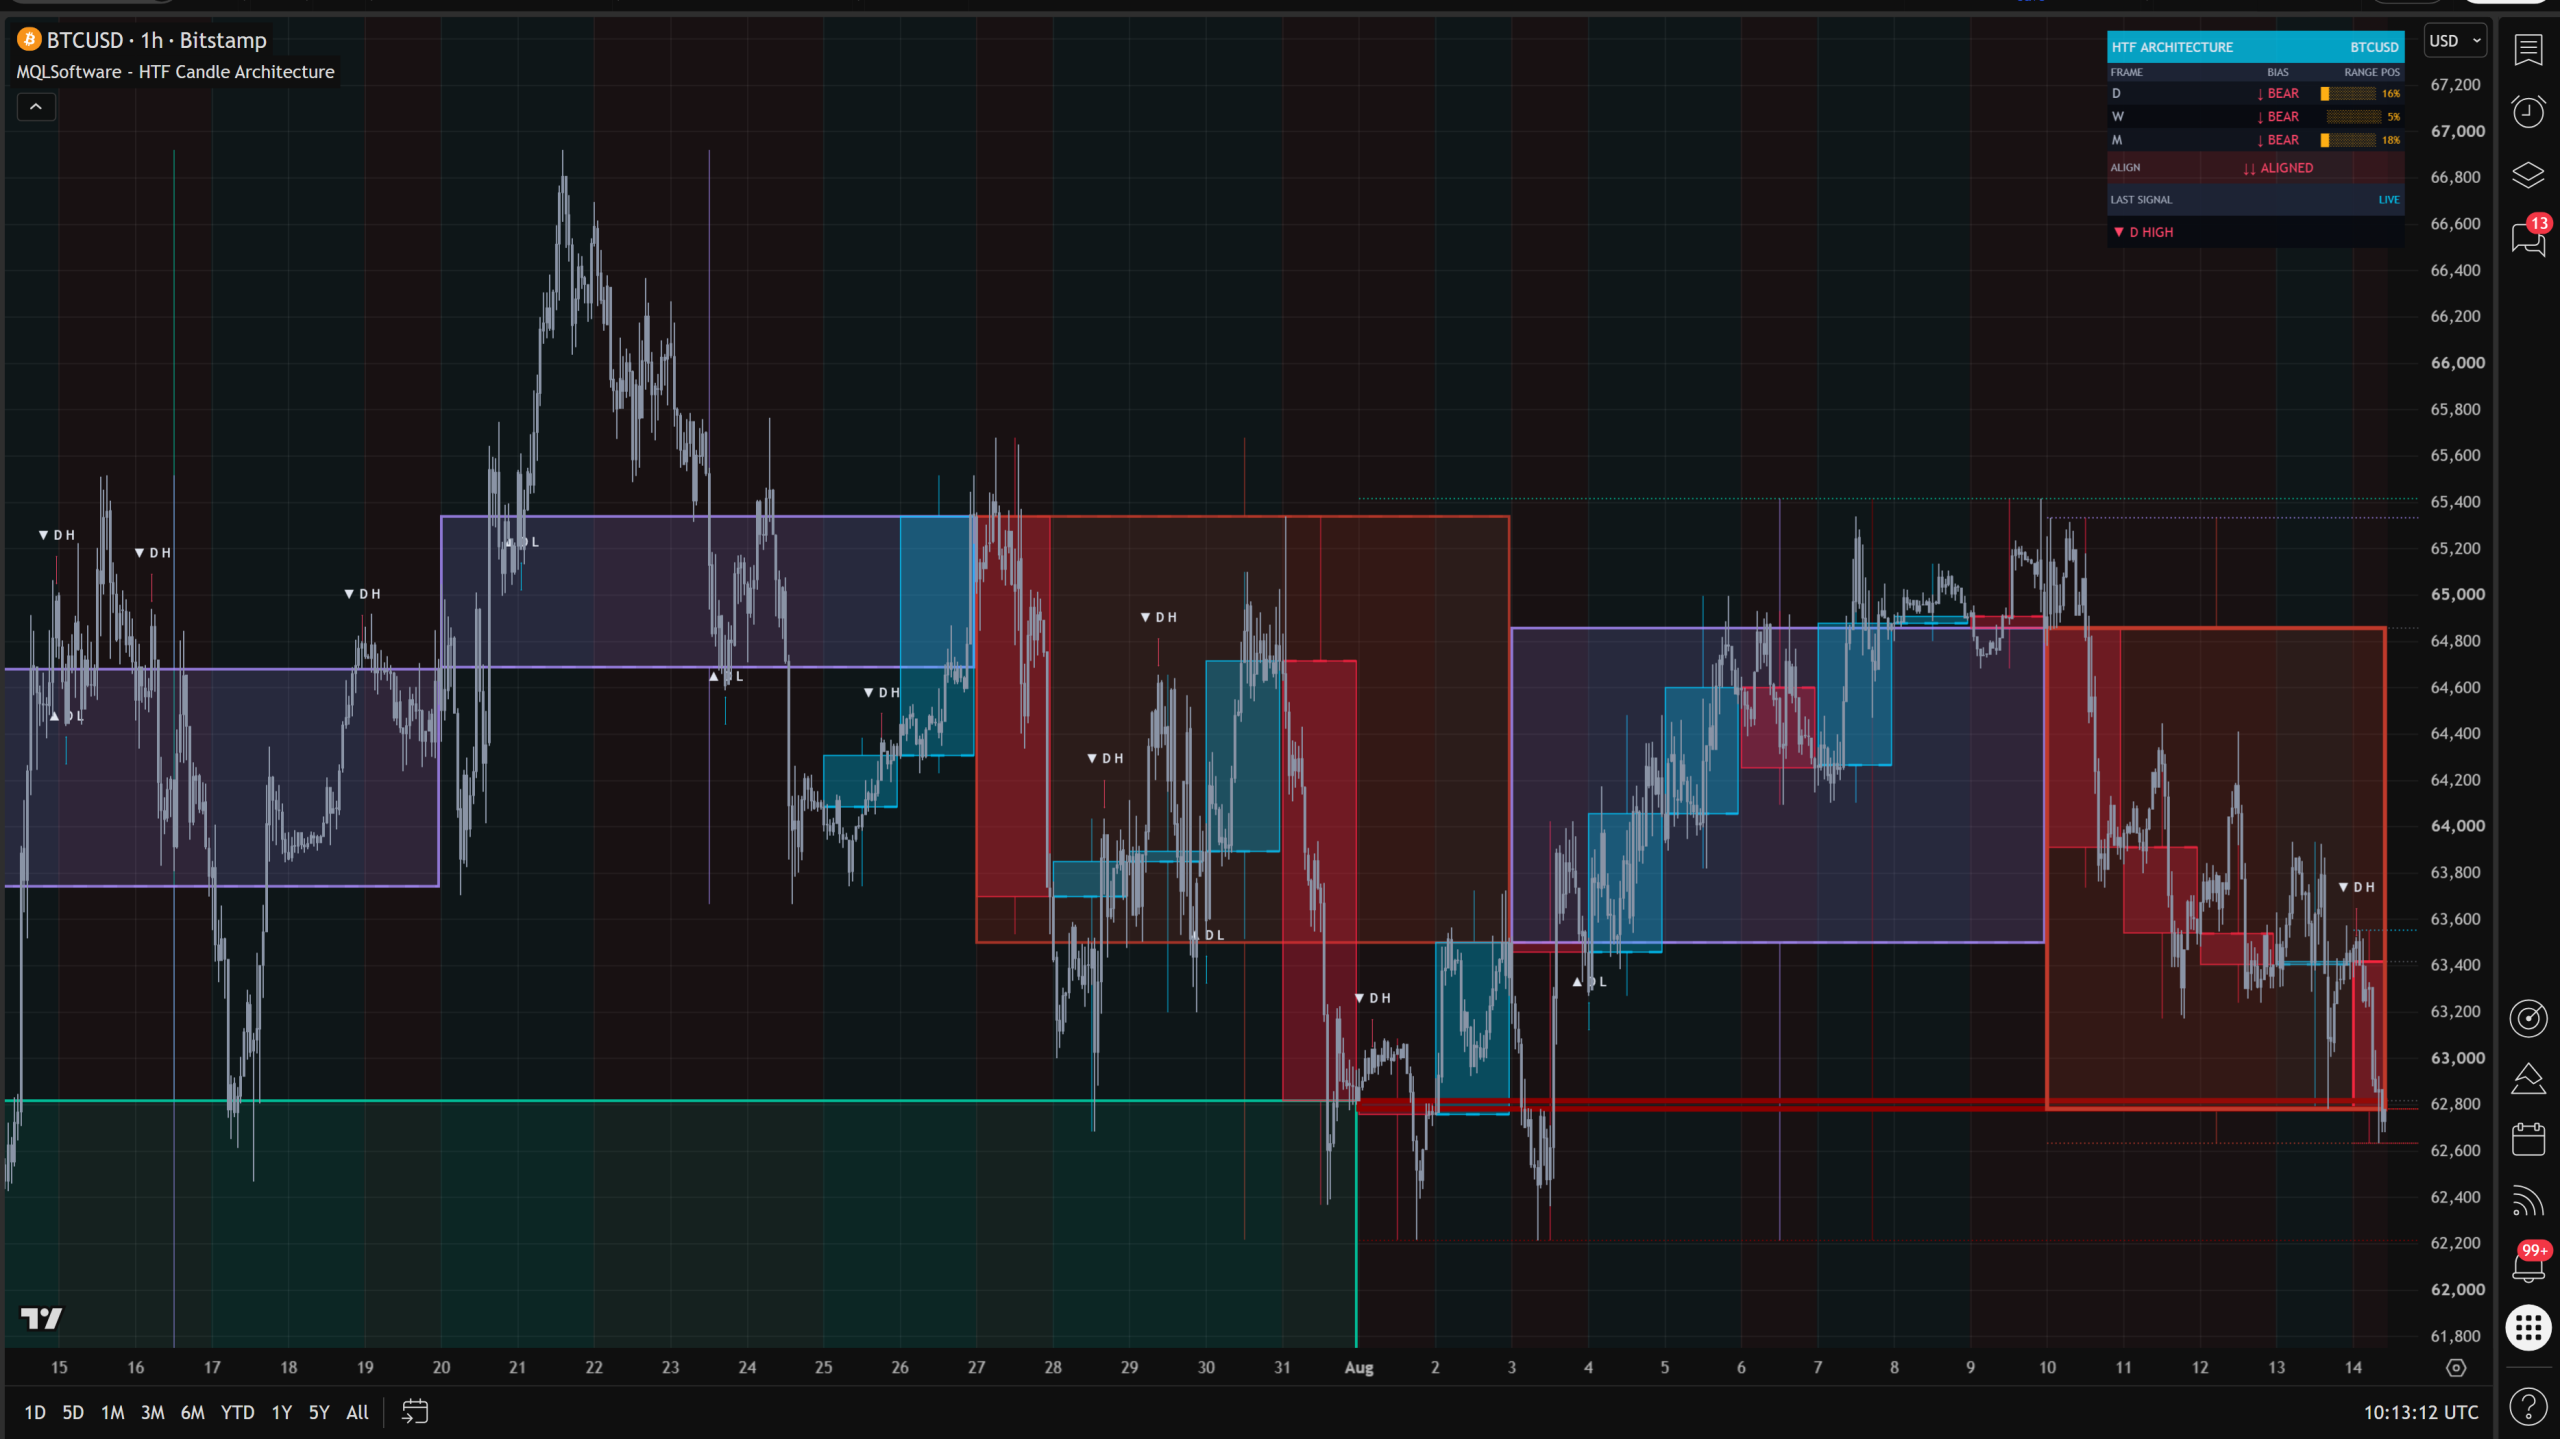
HTF Candle Architecture renders up to three higher timeframes at once — body, wicks and open line for each — with three display modes (Candles, Bars or HL) so the overlay can match however dense you want the chart to look. The nearest timeframe draws heaviest and most opaque, the deepest one fades to near-transparent, and auto-TF selection picks a sensible ladder above your current chart’s timeframe so you’re not hand-configuring three separate resolutions every time you switch charts. The live body isn’t a static snapshot either — it extends bar by bar as the current higher-timeframe candle actually forms, so what you’re looking at is the candle still being built, not yesterday’s close redrawn as a box.
OHLC projection lines carry the levels forward
Each active higher-timeframe candle throws dotted projection lines for its High, Low, Open and Close out to the right, labeled with the timeframe and the price. Those are the levels a Daily or Weekly candle is actually built around, visible on the timeframe you trade without switching to read them and switching back to act on them.
The panel: bias, range position, and one alignment verdict
The read panel lists every active timeframe with its bias (BULL or BEAR) and a Range Position gauge — a block bar showing exactly where price sits inside that timeframe’s candle, flagging amber past 80% or below 20%. Below that sits an Align row that rolls all active timeframes into a single read: ↑↑ ALIGNED, ↓↓ ALIGNED, or ⇅ MIXED. In the screenshot above, Daily, Weekly and Monthly all read BEAR at once — 16%, 5% and 18% into their respective ranges — so the Align row collapses that into one line instead of making you compare three rows by eye. None of this is a forecast: bias and range position describe where price is right now inside a candle that’s already forming, not where it’s going next.
Level-touch signals, and what they aren’t
Level-touch signals mark the bar where price first moves into one of these higher-timeframe levels — a zone-entry filter means it fires once on entry, not on every bar price happens to stay inside the zone, and a per-period gate caps it at one mark per level per higher-timeframe candle. These are structural touch markers, not buy or sell calls. They carry no win rate, no backtest and no probability attached — they only say a level was touched, on a confirmed bar. For the same “higher-timeframe read without switching charts” idea approached through a single oscillator instead of overlaid candles, see our free Trend Integrity Oscillator; for a structural read of trend phases on the timeframe you’re already on, see Trend Channel Navigator.
Confirmed-bar only
Level-touch signals are evaluated on barstate.isconfirmed — a mark only appears once its bar has closed, and it doesn’t move or disappear afterward. The live-growing candle bodies and OHLC projection lines are a visual convenience only (lookahead_on is used for rendering, never for signal logic); the still-forming candle is provisional the same way any live candle is, right up until it closes. For what repainting actually means and why “non-repainting” alone isn’t a complete claim, see what repainting actually is.
FAQ
Is it free?
Yes — free and open-source on TradingView. No invite, no paywall.
Does it give buy/sell signals?
No. Level-touch marks are structural — “price touched this higher-timeframe level” — evaluated on confirmed bars only. They carry no win rate or probability.
Does it repaint?
Signals are confirmed-bar only. The live candle body and OHLC projection lines update as the higher-timeframe candle forms — that’s a visual read of an in-progress candle, the same way any live candle on your chart is provisional until it closes.
How many higher timeframes can I show at once?
Up to three simultaneously, each independently enabled, with auto-TF selection choosing a sensible ladder above your chart’s own timeframe.
Where’s the full setup guide?
Preset choices, alert setup and panel walkthroughs are in the MQLSoftware account area, free with registration.
Download for MetaTrader 4 and 5
Download free MT4 + MT5 ZIP — no registration
Includes compiled indicators, installation instructions and available templates for Windows desktop MetaTrader. Extract the archive and follow INSTALL.txt. Enable DLL imports only for the trusted MQLSoftware indicator: it uses the Windows internet library for activation. No separate DLL is included.
Fresh builds are generated daily. This build: 23 October 2026 01:00 UTC; valid until 23 November 2026 01:00 UTC (31 days from build time). Downloading or sharing an older archive does not restart its term. Online activation and periodic checks are required. You may share or mirror the original ZIP unchanged, including its instructions. Return to this page for current builds.
ZIP size: 253531 bytes. SHA-256: Verify your download
5b272ed1b68ddd66e4f4ee818cd782eccd1fac8056e5ad833bb5af65c5f72992
TradingView video walkthrough
See 3 Higher Timeframe Candles on One Chart, Live (Free TradingView Indicator)
Watch on YouTube. This video shows TradingView; installation in MetaTrader follows the ZIP instructions.