What it measures
Impulse Retention Map focuses on one question after a sharp move: how much of it is still intact? When price makes a short, efficient close-to-close burst, the tool freezes three references: the origin close where measurement started, the impulse close where it was detected, and the halfway level between them. It then follows later closes to see whether price is holding above that structure, has given back half, has returned fully to the origin, or has recovered after a deep pullback.
Detection is automatic and rule-based. With default settings it looks at the change from the close three bars ago to the current close, scaled against volatility measured before the move, and checks that the path was relatively straight and that the final close finished near the extreme of its short range. No manual anchors, external signals, or volume data are needed.
How to read the map
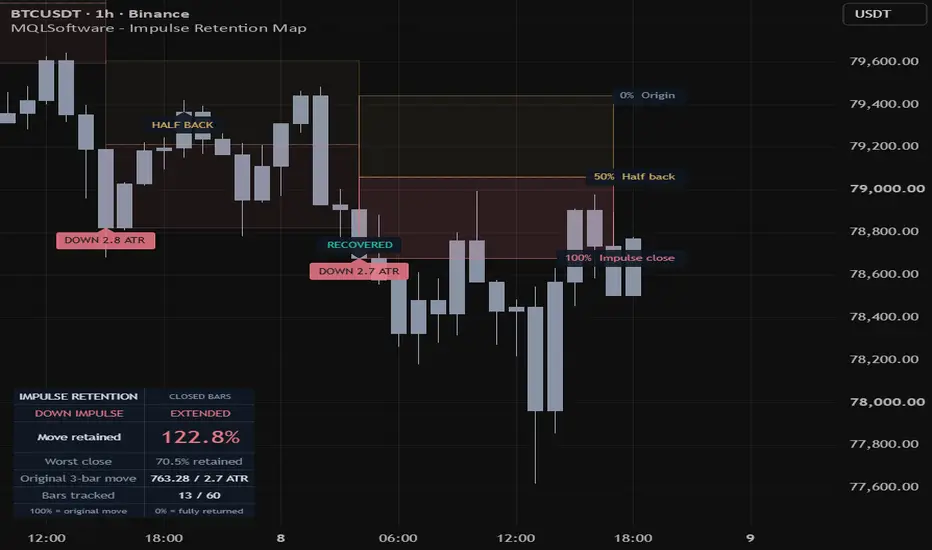
Each map uses the same 0% to 100% scale. The 0% line is the origin close, the 50% line is the midpoint, and the 100% line is the impulse close. Retention is calculated as 100 x (later close minus origin) divided by (impulse close minus origin). The same calculation applies to upward and downward bursts.
Color helps orientation: teal marks upward impulses and rose marks downward impulses. The area between impulse close and midpoint uses the direction color; the area from midpoint to origin uses a quieter amber tint. For a downward impulse, the direction-colored area is lower on the price axis. These are measurement areas, not entry or stop zones. The status panel shows current retention, the lowest retention seen on a confirmed close, the original price distance, the size in pre-move ATR units, and how many bars have been tracked.
Later closes can trigger lifecycle events. HALF BACK means the first close at 50% or less but still above 0%. UNWOUND means a close at 0% or less and ends tracking. RECOVERED means price reached 100% again after a HALF BACK and also ends tracking. If neither happens within the tracking limit, typically 60 bars, the map shows EXPIRED. If a new burst appears first, the old map is REPLACED. Between events you may see HOLDING, EXTENDED, DEEP RETRACE, or REBUILDING.
A worked example
Consider a purely hypothetical illustration to show the math, not a real trade. Suppose an upward move goes from 100 to 110. A later close at 107 would retain 70% of the move. A close at 112 would show 120%, meaning extension beyond the original impulse. A close back at 100 would be 0%, or fully unwound. Only closes count: a wick through 105 or 100 that then closes back beyond it would not create the corresponding event.
Practical setup
Add the indicator to a standard candlestick chart and read the latest fixed levels alongside the panel. Detection defaults are a 3-bar window, 2.0 times ATR with a 20-bar baseline taken before the move, 0.75 path efficiency, and 60 bars of tracking. Raising the size or efficiency filters generally selects fewer, sharper bursts. Display options control how many past maps stay visible, labels, panel position, and colors without changing outcomes. Five alerts are available for new up or down impulses, half returned, fully unwound, and recovered, and they are intended to be set to evaluate on confirmed bar close.
Important limitations
This is a close-based, descriptive tool. It does not reconstruct intrabar order, identify participants, or distinguish gaps from continuous trading. Only one episode is active at a time, so a new map can replace an unresolved one and the visible history is not a complete sample. Changing inputs, symbol, timeframe, or history recalculates the script, and data corrections can alter past inputs. Synthetic chart types measure synthetic prices. The map describes retention; it does not predict recovery or recommend a position.
Platform and source
This guide describes the published TradingView edition. MetaTrader controls and chart appearance may differ; use the instructions included with that build.
Original MQLSoftware publication and current TradingView access. Guide reviewed against the public product description on 13 September 2026. Examples are illustrative, not performance results.