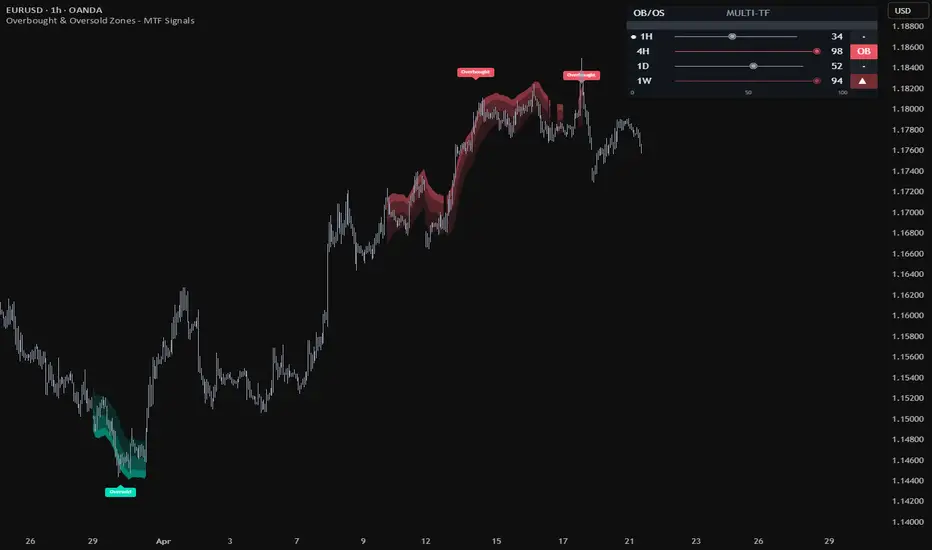
Overbought & Oversold Zones – MTF Signals is a visual analytical indicator that highlights sustained buying or selling pressure directly on the price chart. Instead of showing an oscillator line in a separate pane, it paints gradient zones around price when conditions become extended, with a compact panel for multi-timeframe context.
What it measures
The core calculation is a custom Pressure Index, scaled from 0 to 100 and smoothed with a sensitivity-scaled EMA. It evaluates price relative to a volatility-adjusted baseline using two ideas: persistence, or how consistently price holds above or below the baseline over the measurement window weighted by normalized distance, and displacement, or how far current price is from that baseline in ATR-normalized units.
The baseline adapts to volatility regime. It widens when volatility expands to reduce premature exhaustion readings, and tightens when the market is calm. The result is shaped into zones that follow a dynamic volatility envelope, not fixed rectangles, with thickness scaled by ATR so appearance stays comparable across markets.
How to read the zones and panel
Overbought zones fade downward from the upper envelope into price action. Oversold zones fade upward from the lower envelope. Each zone uses three layers — a dense core near the envelope, a middle fade, and an outer soft fade — to surround the candles involved in the extended move. Close-proximity conditions are merged into a single phase, with one optional text label per phase to keep the chart readable.
The top-right panel shows the current timeframe plus three higher timeframes selected automatically from a standard ladder. Each row includes the timeframe label, a gauge bar with position marker, the numeric 0–100 value, and a state pill for Overbought, Oversold, or neutral direction. The active chart timeframe is marked with a bullet.
A worked example
Suppose price has been climbing steadily and a gradient zone forms along the upper envelope. You might then glance at the panel and see the lower timeframes in an overbought state while the higher timeframes remain neutral. In this purely illustrative case, a trader could use that contrast to describe the move as short-term extended within a still-neutral higher-timeframe context, then watch candle behavior near the edge of the zone and wait for the merged phase to end before reassessing.
Practical setup
Sensitivity offers ten preset levels. Lower levels react faster and suit intraday reading, middle levels provide balanced behavior for general use, and higher levels react more slowly for swing-style review. You can toggle the on-chart zones, the once-per-phase text labels, and the multi-timeframe panel independently. Colors, panel text size, and history depth are customizable. Two alerts are available: one for the first bar of a new Overbought state and one for the first bar of a new Oversold state. The tool can be applied to forex, stocks and indices, commodities, and cryptocurrencies.
Important limitations
This is a context tool for chart reading. It does not execute trades and does not provide financial advice. Extended readings can persist during strong trends, and zones describe past and current pressure, not future direction. Use zone and panel information alongside price structure, independent analysis, and risk management, recognizing that past indicator behavior does not guarantee future results.
Platform and source
This guide describes the published TradingView edition. MetaTrader controls and chart appearance may differ; use the instructions included with that build.
Original MQLSoftware publication and current TradingView access. Guide reviewed against the public product description on 13 September 2026. Examples are illustrative, not performance results.
Download for MetaTrader 4 and 5
Download free MT4 + MT5 ZIP — no registration
Includes compiled indicators, installation instructions and available templates for Windows desktop MetaTrader. Extract the archive and follow INSTALL.txt. Enable DLL imports only for the trusted MQLSoftware indicator: it uses the Windows internet library for activation. No separate DLL is included.
Fresh builds are generated daily. This build: 5 October 2026 01:00 UTC; valid until 5 November 2026 01:00 UTC (31 days from build time). Downloading or sharing an older archive does not restart its term. Online activation and periodic checks are required. You may share or mirror the original ZIP unchanged, including its instructions. Return to this page for current builds.
ZIP size: 194173 bytes. SHA-256: Verify your download
823b4772b16bb32c67ebd4b7e708e4f58a79bc302d5994e214722110afcc272e