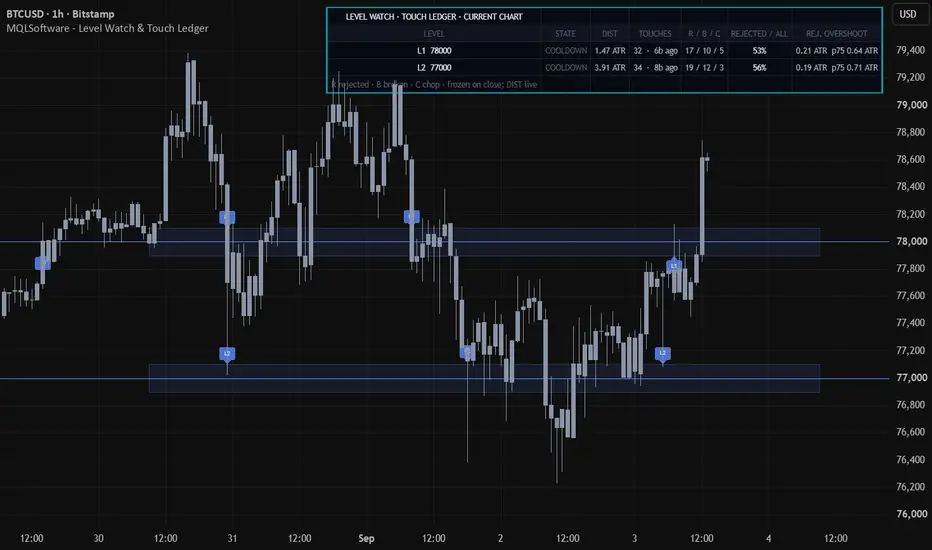
Level Watch & Touch Ledger is for traders who already draw their own levels and want evidence about them. You type in up to eight prices you care about, and the tool keeps a separate audit trail for each one: when price came to it, what happened next, and how far past the line price ran before turning.
What it actually measures
It does not find levels for you. It never scans the chart, clusters highs and lows, ranks zones, or suggests entries, stops, targets, or position size. It answers a narrower question: on this chart, has this level you supplied actually been respected, or does it only look important?
The core problem it solves is noisy touch counts. Without filtering, price grinding sideways on a line can log a touch on every bar. This tool uses a re-arm gate instead. After an event resolves, the level stays quiet until price has closed a configurable ATR distance away and a cooldown period has passed. Only then can another touch be recorded.
How to read the ledger
Each level has a state readout that moves from OUT OF RANGE and WARMING UP to ARMED, PENDING, and COOLDOWN. Alongside that you see touch count, bars since the last touch, and the split of resolved events into rejected, broken, and chop.
Each event resolves exactly once, on a closed bar, and is then frozen. REJECTED means price closed back on the side it approached from by your outcome margin. BROKEN means it closed through by that margin. CHOP means neither happened inside your outcome window. The rejection rate includes chop in its denominator, so sideways outcomes lower the figure rather than disappearing.
Overshoot is shown as median and 75th-percentile rejection overshoot in ATR units. It is calculated on rejections only, because a break by definition has already closed beyond your margin. A bar that gaps clean over a level is recorded separately as a break, so gap-prone symbols do not look artificially reliable.
A A worked example
Imagine you enter a level you have been watching and let several separate visits accumulate. The table might show a handful of touches with a mix of rejections, one break, and one chop event, plus a median overshoot of zero. That means at least half the measured rejections did not extend beyond the exact line, which could prompt you to review how you define the zone. With only a few events, you would treat this as an early audit trail, not as proof about the next visit.
Practical setup
Type a price into a level slot and read that row. Zone half-width controls how close counts as a touch and is shown as a shaded zone. Re-arm distance is the main lever for how many events you get. Outcome window and margin decide how decisively price must move to count as a rejection or break. Rates and overshoot stay behind a minimum-sample setting and read as collecting until enough resolved events exist.
Markers on each recorded touch, level lines, and shaded zones help you match the table to price action. Alerts can notify on a touch and on an outcome, plus a proximity ladder that fires only as price closes in, not as it moves away.
Important limitations
This is a measurement tool for levels you supply, not a level finder and not a signal generator. Samples on a hand-drawn level are naturally small, and the figures describe what the loaded bars on this chart did at your lines. They are not probabilities, expectancy, or forecasts. Counts, outcomes, and markers are closed-bar figures and are never revised once latched, while the distance readout, zone width, and proximity alerts update live inside the forming bar as visual context.
Platform and source
This guide describes the published TradingView edition. MetaTrader controls and chart appearance may differ; use the instructions included with that build.
Original MQLSoftware publication and current TradingView access. Guide reviewed against the public product description on 13 September 2026. Examples are illustrative, not performance results.
Download for MetaTrader 4 and 5
Download free MT4 + MT5 ZIP — no registration
Includes compiled indicators, installation instructions and available templates for Windows desktop MetaTrader. Extract the archive and follow INSTALL.txt. Enable DLL imports only for the trusted MQLSoftware indicator: it uses the Windows internet library for activation. No separate DLL is included.
Fresh builds are generated daily. This build: 5 October 2026 01:00 UTC; valid until 5 November 2026 01:00 UTC (31 days from build time). Downloading or sharing an older archive does not restart its term. Online activation and periodic checks are required. You may share or mirror the original ZIP unchanged, including its instructions. Return to this page for current builds.
ZIP size: 195681 bytes. SHA-256: Verify your download
2e24b7bc5fb63bcb3e28ac69b14041315d954379c2810474fb42c6e5bb2255b9
TradingView video walkthrough
How to Use Level Watch & Touch Ledger – Full Chart Walkthrough
Watch on YouTube. This video shows TradingView; installation in MetaTrader follows the ZIP instructions.