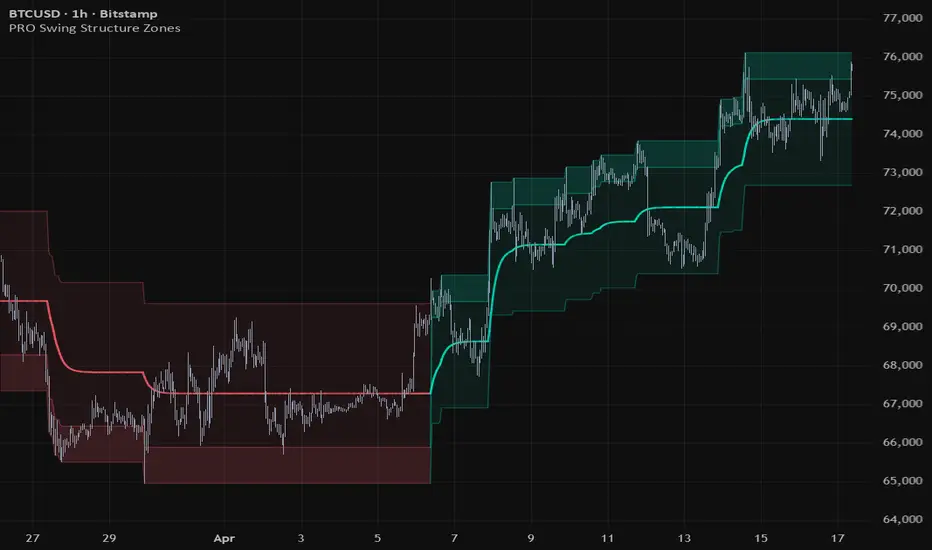
What it measures
PRO Swing Structure Zones is a visual overlay that shows how price organizes around an adaptive structural framework. Instead of issuing entry or exit signals, it evaluates how price moves and expands as volatility changes, then draws dynamic zones that adapt to the instrument and timeframe. The goal is to make structure visible: whether price is stretching in the direction of a move, compressing sideways, or shifting from one directional phase to another. It provides context for analysis, not instructions for trading.
How to read it
The display centers on dynamic channel boundaries that move with price. Upper zones reflect areas where price has extended within a directional move, while lower zones reflect sustained opposing pressure. When the channel widens, it suggests structural expansion; when it narrows, it suggests contraction or consolidation. A shift or tilt in the channel points to a possible change in trend behavior. An optional smoothed midline can be enabled to visualize internal trend flow inside the structure.
A hypothetical example
Imagine observing a market that has been moving sideways with relatively narrow zones. Price then begins to hold consistently in the upper portion of the structure while the channel gradually widens and tilts upward. In this clearly hypothetical illustration, a trader would not read this as a buy signal, but as a visual description: price is expanding in one direction and the structure is adapting to that behavior. If price later fails to hold the upper area and drifts toward the midline and lower boundary, the same trader would interpret it as loss of directional stretch and possible transition.
Practical setup
Setup is intentionally simple. Start in Auto mode, which lets the calculation adapt the structure logic to the current instrument and timeframe. This is helpful when switching between markets such as forex, stocks, indices, commodities, and crypto, or when comparing higher and lower timeframes. Switch to Manual mode only if you want direct control over channel width. Choose Narrow for tighter, more sensitive zones, Medium for balanced display, or Wide for broader context. You can also toggle the trend midline for internal flow and the channel fill to highlight the active zone.
Important limitations
It is important to understand what this tool does not do. It does not provide entry signals, trade confirmations, or stop-loss and take-profit levels, and it is not a standalone trading system. Zone position alone does not define support, resistance, or trend strength. Like any volatility-sensitive visualization, its appearance will change as conditions evolve, so it is best used alongside independent analysis, other analytical methods, and careful risk management.
Platform and source
This guide describes the published TradingView edition. MetaTrader controls and chart appearance may differ; use the instructions included with that build.
Original MQLSoftware publication and current TradingView access. Guide reviewed against the public product description on 13 September 2026. Examples are illustrative, not performance results.