A horizontal line can remain visible after several visits without gaining a stronger classification. Price Reaction Levels deliberately treats repeated contact as a change of state rather than automatic confirmation. That is a rule of this indicator’s level model, not a universal claim about how every market must behave.
Price Reaction Levels treats that history as part of the level itself. Early tests keep a clear, solid presentation. After four or more recorded reactions, the line changes to a dashed weak state. The chart therefore distinguishes a relatively fresh area from one that price has already worked through repeatedly.
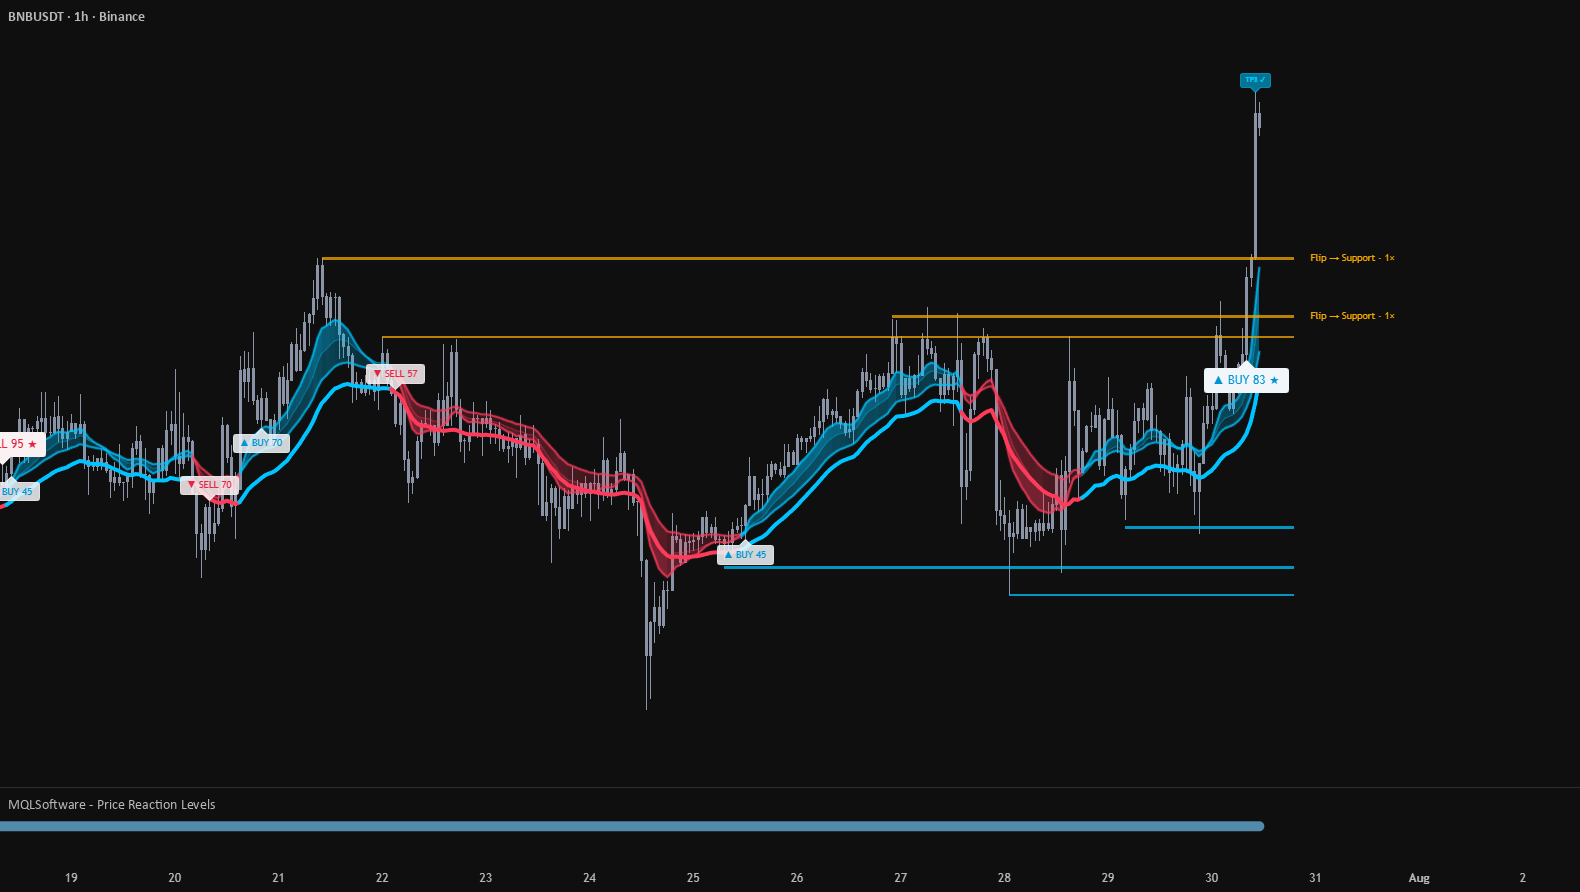
A reaction level is a record, not a permanent line
The indicator waits for a swing pivot to be confirmed before it creates support or resistance. That confirmation delay is intentional: the level appears only after the configured number of bars has closed on the far side of the pivot.
Nearby pivots of the same type are consolidated instead of producing a stack of almost identical lines. During that merge, the displayed price is recalculated from the existing level and the incoming pivot, while the original pivot bar remains the level’s creation anchor. A merge therefore refines the horizontal price without rewriting when the level was born.
The same record also tracks what happens next. A decisive close through an untouched level changes its role once: former resistance can become support, and former support can become resistance. If price breaks it again, the level is retired. Colour, line style and label text communicate those state changes directly on the chart.
For a broader view of liquidity areas and structural zones, see Liquidity Map & Order Blocks.
Trend context comes from two different decisions
Price Reaction Levels does not ask one moving average to do every job. Its ribbon and trail interpret the same market from different angles.
The Reaction Flow Average changes its response rate with the Efficiency Ratio. It follows clean directional movement more closely and becomes more restrained when price is wandering. Each ribbon calculation maintains its own recursive history, so the result is not a fixed-speed average with a cosmetic colour change.
The Adaptive Reaction Trail is a one-way boundary. Its distance responds to current efficiency, and once it advances in the active direction it does not loosen. That makes it a structural counterpart to the smoother rather than a duplicate vote.
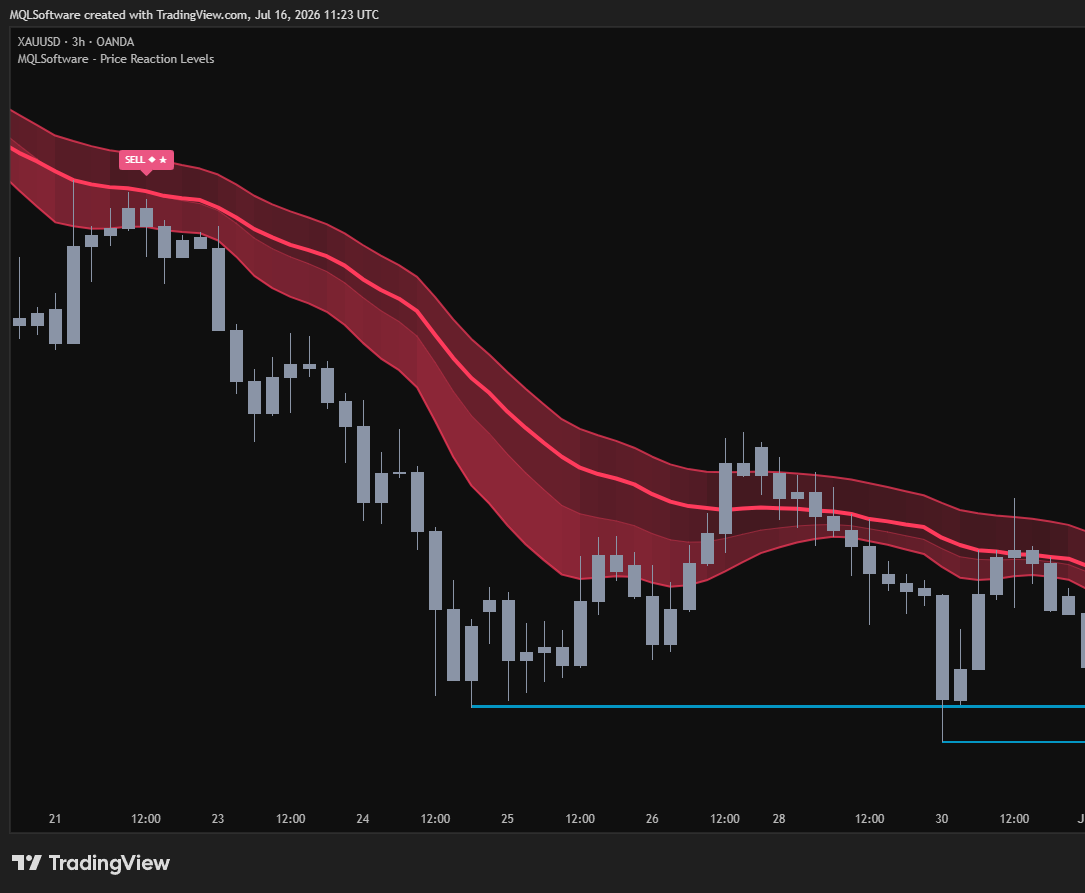
A trend-state change requires agreement between these two engines. When their readings differ, the existing state remains in place until they align. Our free Trend Integrity Oscillator explores the same pullback-versus-reversal question in a separate pane.
The grade organizes context; it does not predict an outcome
Each setup receives a grade from three pieces of chart context: its setup family, higher-timeframe direction and, for a level reaction, the level’s test history. The grade is a comparison aid for the conditions currently visible on the chart. It is not a forecast, probability or promise of a trading result.
The selected quality threshold applies directly to Level Reaction and Ribbon Pullback. The Day Trading preset deliberately gives Trend Flip a lower internal threshold. That preset exception means a confirmed Trend Flip can appear below the selected global minimum; the other setup families still use the minimum as entered.
Three setup families can be identified on the chart:
- Level Reaction — price rejects a tracked level in the active trend context.
- Trend Flip — both trend engines establish a new shared direction.
- Ribbon Pullback — price returns to the ribbon inside an established trend state.
When a confirmed setup passes its applicable gate, the indicator draws an entry, a stop behind the structure that defined the setup, and three staged target levels derived from the entry-to-stop distance. These drawings are planning aids; the indicator does not send orders to a broker.
What “confirmed” means here
Signals, level events and plan events are created only when barstate.isconfirmed is true. They do not appear midway through a candle and then disappear before its close. Higher-timeframe direction is taken from the last closed higher-timeframe bar, using a one-bar offset.
Pivot confirmation has unavoidable latency: if the sensitivity is set to several bars, the script needs that many later closes before the pivot is known. The current ribbon leg may respond while the latest candle is forming, but that display update cannot create a signal or change confirmed level history.
The merge behaviour is also confirmed-bar bookkeeping. It may refine a level’s price, but it does not replace the stored creation bar with the bar on which the merge occurred.
For a practical explanation of these distinctions, read What repainting actually is — and why no-repaint still isn’t enough.
FAQ
Is it free?
No. Price Reaction Levels is invite-only and closed-source on TradingView, and is included with MQLSoftware access. The open-source tools linked above remain free. A standalone lifetime licence — no bundle required — is also available at $129.
Why is the source closed?
The implementation is part of the product. The public documentation instead explains the visible behaviour: how a level changes state, how trend agreement works, what enters the grade and when a chart event becomes final.
Which markets and timeframes can it display?
It is designed for forex, stocks and indices, commodities and crypto. The engines use the Efficiency Ratio and ATR-scaled distances rather than fixed price units, while the trading style can follow the chart timeframe or be selected manually.
Does it place trades?
No. It is a visual analytical tool for structure mapping and chart planning. It does not execute trades and does not provide financial advice.
Where are setup instructions?
The Client Area guide covers presets, alerts and configuration for members with access.
TradingView video walkthrough
How to Use Price Reaction Levels — Full Chart Walkthrough
Watch on YouTube. This video shows TradingView; installation in MetaTrader follows the ZIP instructions.