Drawing a trendline is easy. Deciding which swings deserve to anchor it is the subjective part. Auto Trendlines & Market Structure — MTF is a free, open-source TradingView overlay that builds one resistance line and one support line from confirmed swing pivots, checks each candidate against older structure, and keeps retired lines as a visible historical trail. It adds a seven-state structure read and a higher-timeframe comparison panel without presenting any of them as a price forecast.
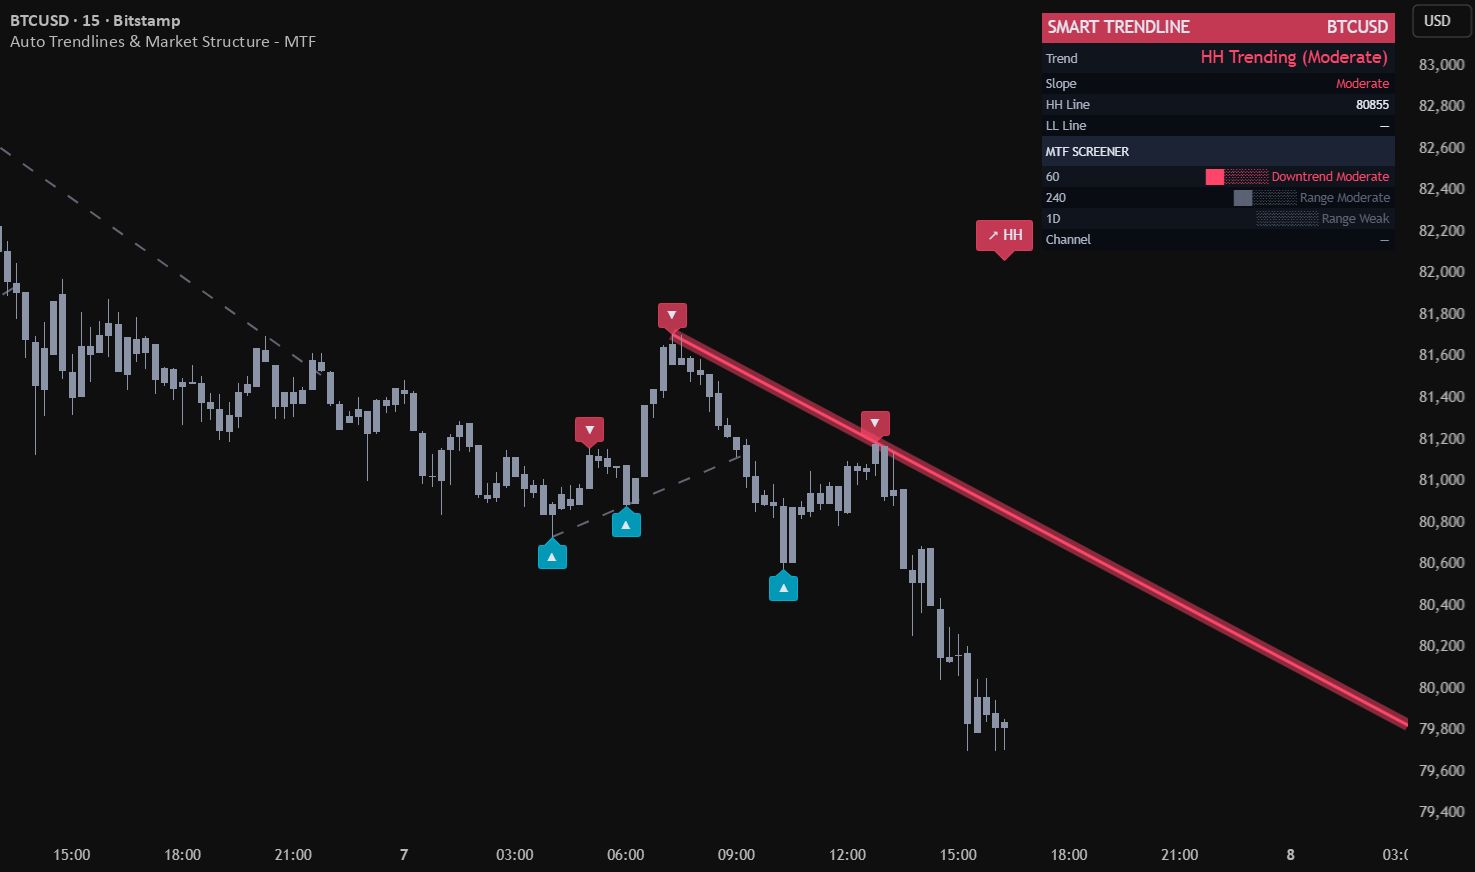
Two active lines, with the discarded history still visible
Resistance is built from the two newest confirmed pivot highs; support uses the two newest confirmed pivot lows. Only the current pair stays bright, rendered as a solid core with a wider glow. When a newer pivot pair replaces a line, or when price invalidates it, the old line stops extending and freezes as a dashed reference.
That lifecycle matters when reviewing a chart in hindsight. The tool does not quietly drag an old anchor to a more convenient swing. You can see where earlier boundaries were, when they stopped being current, and how the new structure took over. The historical layer is capped in the code so it remains context rather than permanent chart clutter.
A two-point fit has to survive older pivots
The newest two pivots are only the starting candidate. Before a resistance line becomes active, the script checks up to four older pivot highs; support is checked against older pivot lows. A candidate is rejected if an older pivot contradicts it by more than 0.3 ATR. This tolerance and the number of checked pivots are defined in the Pine source, not inferred from a screenshot.
The check does not prove that a line will hold. It answers a narrower and more useful question: does the neat line through the newest pair already conflict with confirmed structure sitting behind it? If it does, the overlay leaves that candidate inactive.
Seven structural states instead of a single trend label
The script normalizes each active line’s slope by ATR and combines the signs of the support and resistance slopes. The result is one of seven readable states:
- Uptrend or Downtrend when both boundaries slope in the same direction.
- Expanding when resistance rises while support falls.
- Contracting when resistance falls while support rises.
- Range when neither slope clears the directional threshold.
- HH Trending or LL Trending when only one validated boundary is active.
Strength is shown separately as Weak, Moderate, Strong or Very Strong. That separation prevents a common reading error: “Expanding” describes the relationship between the boundaries; it does not mean the same thing as a strong directional trend.
For a phase-based view built around regression rather than pivot-to-pivot boundaries, compare the Trend Channel Navigator. For qualified impulse legs and correction zones, see Impulse Waves & Reversal Zones.
What counts as a break
A wick through a line does not retire it. The source invalidates resistance only when a confirmed close finishes more than 0.5 ATR above the projected line; support uses the mirrored condition below. At that point the active line freezes at the break bar and the optional structure-break alert can fire.
This is structural invalidation, not a promise that price will continue after the close. The alert reports a chart event. It does not place an order, specify risk, or label the event as a buy or sell instruction. The distinction is the same one explained in our guide to structural breaks and invalidation.
The MTF panel uses closed higher-timeframe data
The panel shows the chart’s current class and strength, the active line values, channel width when both lines exist, and three automatically selected higher-timeframe rows. Those higher-timeframe rows request the prior closed higher-timeframe values with lookahead disabled. The tradeoff is deliberate: an HTF row can be one higher-timeframe bar behind the still-forming candle, but it does not rewrite its historical reading after that bar closes.
Confirmed pivots also have an unavoidable delay: a swing can only become a pivot after the lookback window has passed. That is not a defect hidden by the interface; it is the cost of anchoring lines to confirmed swings. Our broader non-repainting indicator guide explains why confirmation delay and live-bar movement should be discussed separately.
Settings verified against the Pine source
The settings are intentionally compact:
- Pivot Lookback Mode defaults to Adaptive. The source clamps the adaptive window from five to ten bars based on ATR relative to price. Fixed mode exposes a lookback from three to fifteen bars and defaults to five.
- Show Trend Lines, Show Channel Fill, Show MTF Panel, Show Pivot Markers, Show Trend Status and Show Line Labels independently control the visual layers.
- Line Width (Core) ranges from one to five and defaults to three; the glow is rendered seven pixels wider than the core.
- Alert on Trend Change and Alert on Trendline Break are both off by default. When enabled, their conditions remain gated to confirmed bars.
There are no user inputs for changing the validation tolerance, the confirmed-close break tolerance, or manually choosing the three higher timeframes in this version. If a setting is not listed above, do not assume the indicator exposes it.
Honest limitations
This overlay standardizes one way of drawing and classifying structure; it does not make that structure predictive. Pivot confirmation introduces delay. ATR normalization makes slope easier to compare across markets, but it does not make different instruments behave alike. A confirmed close beyond a line says the line was invalidated under the script’s rule, not that the next move is known.
The panel also does not evaluate transaction costs, liquidity, position size or any trading plan. Use it to keep line selection and structural labels consistent, then apply independent analysis to whatever decision comes next.
FAQ
Is Auto Trendlines & Market Structure — MTF free?
Yes. The live TradingView page identifies it as an open-source script and makes it available to use on a chart.
Does it draw buy and sell signals?
No. It draws structural boundaries, class labels and confirmed-bar change alerts. These are chart events, not trade instructions.
Why did a trendline appear after the swing?
Pivots are confirmed only after the selected lookback window has passed. The delay prevents the script from treating an unfinished swing as a finished anchor.
Can I choose the higher timeframes manually?
Not in the current Pine source. The panel selects three higher timeframes automatically from the chart timeframe.
Where can I inspect the indicator?
Open the free script on TradingView from the button below. Because it is open-source, its published Pine code can be reviewed directly.
Download for MetaTrader 4 and 5
Download free MT4 + MT5 ZIP — no registration
Includes compiled indicators, installation instructions and available templates for Windows desktop MetaTrader. Extract the archive and follow INSTALL.txt. Enable DLL imports only for the trusted MQLSoftware indicator: it uses the Windows internet library for activation. No separate DLL is included.
Fresh builds are generated daily. This build: 5 October 2026 01:00 UTC; valid until 5 November 2026 01:00 UTC (31 days from build time). Downloading or sharing an older archive does not restart its term. Online activation and periodic checks are required. You may share or mirror the original ZIP unchanged, including its instructions. Return to this page for current builds.
ZIP size: 201104 bytes. SHA-256: Verify your download
54fa36cfe0bdcc78fdb6c00f81e13b7b09c44003c2552d1256992dcbf1706490