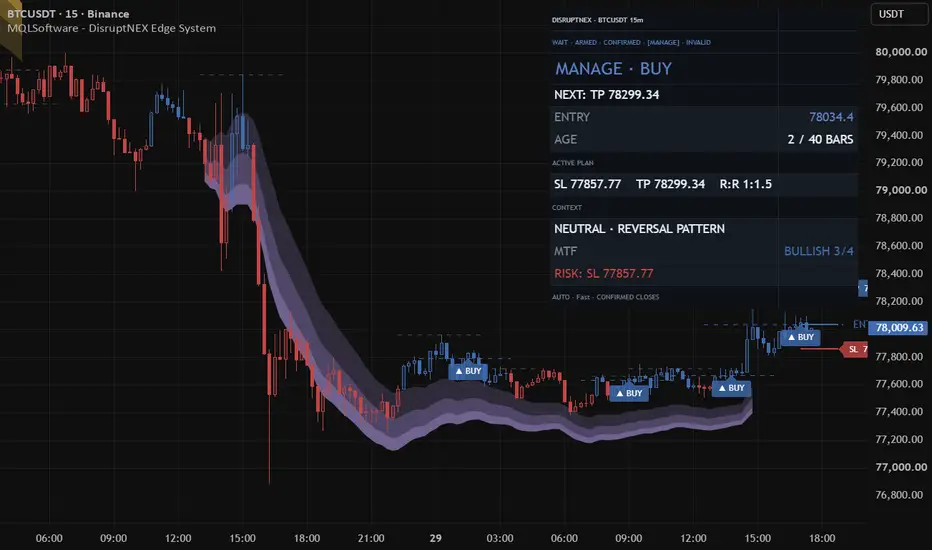
What it measures
DisruptNEX Edge System is an analytical overlay that visualizes market direction, trend maturity, exhaustion conditions, and impulse activity within a single framework. Rather than combining independent tools, all visual elements are derived from a shared internal reference, so trend context, exhaustion states, impulses, and higher-timeframe structure remain consistent.
At its foundation is a price-centered baseline computed as a windowed mid-range estimator with optional adaptive smoothing. This baseline defines the market regime: price above it reflects bullish directional pressure, while price below it reflects bearish pressure. All other components evaluate price relative to that regime reference.
How to read it
Start with candle coloring, which expresses the active regime directly on price. Next, watch for overbought and oversold ribbons drawn on the chart itself. These reflect a persistence-based evaluation of how consistently price holds above or below a volatility-adjusted reference. A ribbon marks the initial appearance of an exhaustion state, and its continuation shows the state remains active.
Spark impulses highlight increased directional pressure within the regime. They are based on volatility-normalized displacement from the baseline across multiple smoothing horizons, often appearing after consolidation or pullbacks. Dynamic structural reference zones show contextual support and resistance from recent behavior and volatility. The compact HUD summarizes overbought or oversold state, trend direction, and Trend Power across timeframes. Trend Power measures price progression since the last confirmed regime change, normalized by volatility and mapped to a bounded scale.
Hypothetical example
Imagine price is holding above its baseline, indicating a bullish regime. After an advance, an overbought ribbon appears, suggesting price is becoming stretched relative to the regime. A candlestick pattern then prints, flagging a possible short-term pause rather than a reversal instruction. Price consolidates without changing regime, then a Spark impulse appears in the bullish direction, suggesting activity is resuming. Checking the HUD, the trader sees higher timeframes remain bullish but show different levels of maturity.
Practical setup
Read the chart top-down: confirm regime from candles, check exhaustion for stretched conditions, treat patterns as cues to observe more closely, look for Sparks after hesitation, and use structural zones to judge current price location. Alerts are event-based and trigger only on confirmed state changes, including regime transitions, exhaustion entries, pattern detection, and Spark events. Note that structural levels update only on the most recent bar.
Important limitations
The system supports discretionary analysis only. It does not execute trades or provide trade instructions. Patterns are contextual, not standalone reversal signals. Exhaustion describes stretched conditions where pauses may develop, not a guaranteed turn. Structural zones are spatial guides, not predictive targets, and choppy conditions can produce frequent regime transitions.
Platform and source
This guide describes the published TradingView edition. MetaTrader controls and chart appearance may differ; use the instructions included with that build.
Original MQLSoftware publication and current TradingView access. Guide reviewed against the public product description on 13 September 2026. Examples are illustrative, not performance results.
TradingView video walkthrough
How to Use DisruptNEX Edge System – Full Chart Walkthrough
Watch on YouTube. This video shows TradingView; installation in MetaTrader follows the ZIP instructions.