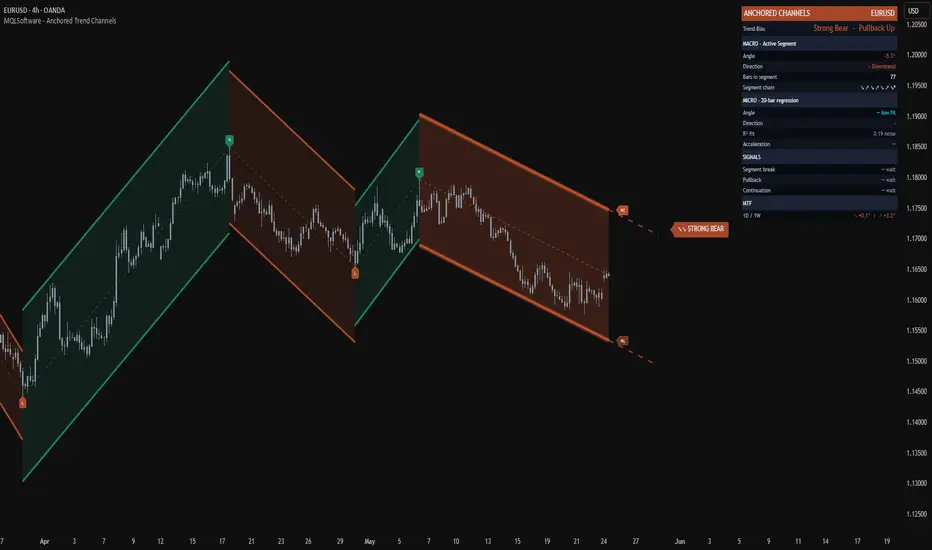
Anchored Trend Channels by MQLSoftware is a structural overlay designed for chart reading and structure mapping. Instead of fitting one continuous band to all price history, it divides price action into discrete phases between confirmed swing points and draws each phase as its own parallel channel.
What It Measures
Each Macro channel represents one trend phase between two opposite pivots. Its basis line connects the anchor pivots, while its width reflects the maximum deviation of price inside the segment, adjusted by a multiplier and an ATR-based minimum. This shows the slope, width, and angle of that specific phase. The active segment adds a dashed projection of about 20 bars to visualize where boundaries would lie if the current slope continued. Inside the active segment, an adaptive Micro regression channel tracks shorter-term momentum and reports its fit quality with an R-squared readout.
How to Read It
Historical segments appear as a left-to-right chain that traces how the trend developed, where it paused, and where it changed direction. The right-most active segment is highlighted and updates as new bars form. The right-side panel summarizes the read: Trend Bias, Macro angle and direction, bars in the segment, segment chain, Micro angle and R-squared, Acceleration, and multi-timeframe context. Trend Bias is weighted by segment length and angle plus net price move, so longer, steeper phases count more than short retracements. Acceleration compares Micro angle minus Macro angle to show whether local momentum is steeper, flatter, or broadly aligned with the broader phase.
Hypothetical Example
Imagine price forms a series of alternating channels, then begins a new upward phase. The active Macro channel slopes upward with its dashed extension projecting forward. The Micro channel inside it also slopes upward and remains visible because its fit quality is sufficient. Acceleration is positive, suggesting local momentum is steeper than the surrounding phase. Later, price closes near the lower boundary of the Macro channel. That appearance could be marked as a structural pullback event for context, not as an instruction to act, and would be weighed alongside higher-timeframe direction and other analysis.
Practical Setup
Start with Pivot Sensitivity, which controls how many segments appear. Shorter settings create more, shorter phases, while longer settings create fewer, longer-lived phases. Quality filters require a minimum pivot-to-pivot distance in ATR and a minimum bar count before a new segment is committed, which helps skip minor noise. You can adjust channel width, regression length, R-squared visibility, and the cooldown between same-type event markers to reduce clustering. Three optional markers describe channel geometry: Segment Break, Macro Pullback, and Micro Continuation. A Non-Repaint Mode toggle limits active-segment updates to closed bars for a more stable display.
Important Limitations
This is a visual analytical tool only. It does not execute trades and does not provide financial advice. Pivots are confirmed with delay, so new segments and markers appear after the fact and historical structure can look clearer than real-time decisions felt. The active channel boundary can shift as new bars form, especially with intra-bar updates enabled. The Micro channel hides when price is too noisy for a meaningful regression. Multi-timeframe values provide context but do not confirm direction. Structural events describe geometry only and should be combined with other analysis and risk management.
Looking for the newer channel tool?
Anchored Trend Channels remains available on TradingView. Trend Channel Navigator is the later channel product and has separate MT4/MT5 downloads. Their settings and outputs should not be treated as interchangeable.
Platform and source
This guide describes the published TradingView edition. MetaTrader controls and chart appearance may differ; use the instructions included with that build.
Original MQLSoftware publication and current TradingView access. Guide reviewed against the public product description on 13 September 2026. Examples are illustrative, not performance results.