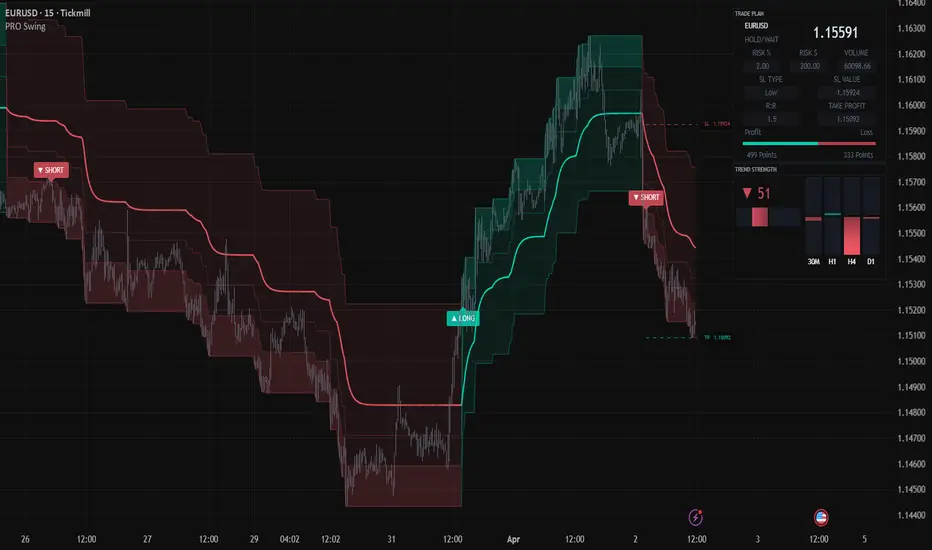
The Pro Swing Trading System is built to bring structure to swing trading. Rather than using separate tools for trend reading, entry planning, and risk math, it combines a visual trend channel, marked swing levels, and on-chart risk calculations in a single view. The goal is to help you see context, plan levels, and size positions in a consistent way.
What it measures
The core of the system is a color-coded trend channel that adapts to price direction. It is designed to show whether price is moving in an ascending or descending structure and where prior swing points may matter again. Around this channel, the tool marks Main Swing Levels and Echo Swing Levels as areas of interest for possible reversals or trend continuations. It also projects stop-loss and take-profit levels, and includes a Position Size Calculator to translate risk settings into position size. A separate Trend Strength Monitor summarizes trend direction across higher timeframes for added context.
How to read it
Start with the channel color and slope to gauge the current directional bias. Entry markers suggest where long or short interest could develop, but they are best read together with the swing levels. The Main Swing Level represents the primary area of interest, while the Echo Swing Level offers a secondary area that can be useful for phased entries or when the first level is missed. Stop-loss and take-profit lines are plotted with absolute values and can be adjusted directly on the chart. You can work with one take-profit target or two targets for a staged exit. The Trend Strength Monitor helps you check if higher timeframes generally support the direction you are considering.
A A worked example
Imagine an asset has been declining inside a descending channel. Price pauses and the system marks a potential long entry at a Main Swing Level, with stop and take-profit levels displayed. Before acting, you check the Trend Strength Monitor and see that several higher timeframes still point downward. In this hypothetical case, a trader focused on trading with the broader trend might decide to skip the counter-trend long and wait for price to reach a short-side swing level that better matches the higher-timeframe context. The point is process: signal, level, then broader-trend check.
Practical setup
Channel width controls how sensitive the channel is to price movement. A narrower setting reacts faster but may shift more often, while a wider setting is smoother but slower to adapt. Signal frequency can be set toward a more conservative, balanced, or aggressive style depending on how many signals you want to review. Alerts can be configured for entry points, trend changes, and other key events. Trading time filters allow you to limit attention to preferred sessions or days. In the Position Size Calculator, set your risk percentage, stop-loss type, and profit-to-loss relationship, then review how the calculated size and absolute stop and target values change when you adjust levels on the chart.
Important limitations
No indicator can predict reversals or guarantee trend continuation. In choppy or ranging markets, channels can change direction and swing levels can be tested without follow-through. Alignment on higher timeframes improves context but does not remove risk. The calculator only reflects the values you enter; it does not control execution, slippage, or gaps. Signals and levels should be reviewed as part of a defined plan with fixed risk rules, careful adjustment of settings, and practice on historical and demo data before live use.
Platform and source
This guide describes the published TradingView edition. MetaTrader controls and chart appearance may differ; use the instructions included with that build.
Original MQLSoftware publication and current TradingView access. Guide reviewed against the public product description on 13 September 2026. Examples are illustrative, not performance results.
TradingView video walkthrough
How to Use PRO Swing Trading System – Full Chart Walkthrough
Watch on YouTube. This video shows TradingView; installation in MetaTrader follows the ZIP instructions.