What it measures
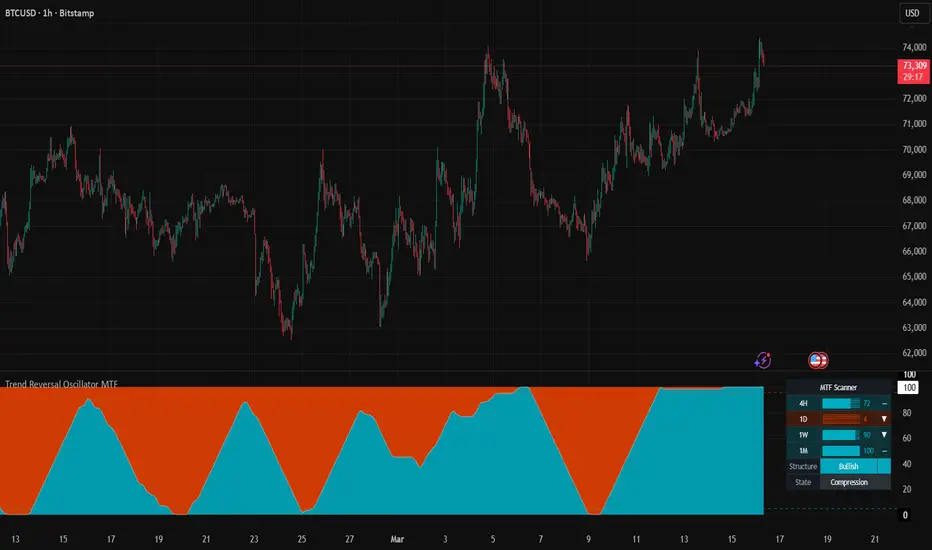
The Trend Reversal Oscillator MTF is designed to show how persistent directional pressure is, rather than simply whether price moved up or down. It evaluates how consistently price holds above or below a volatility-adjusted baseline derived from price and market volatility. When price stays on one side of that baseline, the oscillator reflects building persistence. When that persistence begins to fade, its movement can visualize a possible transition phase in momentum.
How to read it
The oscillator moves on a bounded 0–100 scale. Higher values represent sustained bullish pressure, while lower values represent sustained bearish pressure. Readings that remain near the upper or lower areas suggest directional activity has been prolonged. Focus less on a single bar and more on behavior: how long the reading stays extended, whether it continues to push, flattens, or turns back toward the middle. An integrated scanner adds broader context by summarizing oscillator level, directional slope, structure bias, and regime state across higher timeframes.
A A worked example
Imagine an illustrative uptrend where price advances steadily for many bars. During that phase, the oscillator holds in its upper area, showing bullish persistence is intact. Price then starts to move sideways with smaller ranges and less follow-through, while the oscillator drifts away from its prior extreme. This visual shift suggests upward persistence is weakening, not that a reversal is confirmed. A check of the scanner can help frame it: continued bullish higher-timeframe bias might suggest local digestion, while softening higher-timeframe readings might suggest broader exhaustion is developing.
Practical setup
Start with the Balanced Trading Profile, intended as a default for most markets. Use Conservative for slower, smoother response or Aggressive for faster reaction to pressure changes. Then match the Market Speed setting to conditions: Slow Markets for smoother behavior, Mixed Markets for balanced sensitivity, and Fast Markets for more reactive behavior when volatility is elevated. A common workflow is to note extended oscillator conditions, observe price behavior around those extremes, check the scanner for higher-timeframe alignment, and then consult price structure or other analytical tools.
Important limitations
This is a visual decision-support tool, not a trading system and not financial advice. Extended readings can persist for a long time in strong trends, so an extreme alone does not confirm a turn. Faster settings highlight transitions earlier but fluctuate more, while slower settings are smoother but respond later. Interpret all outputs alongside price structure, independent analysis, and careful risk management.
For the separate product with an exhaustion-signal workflow, see the Trend Reversal Indicator guide.
Platform and source
This guide describes the published TradingView edition. MetaTrader controls and chart appearance may differ; use the instructions included with that build.
Original MQLSoftware publication and current TradingView access. Guide reviewed against the public product description on 13 September 2026. Examples are illustrative, not performance results.