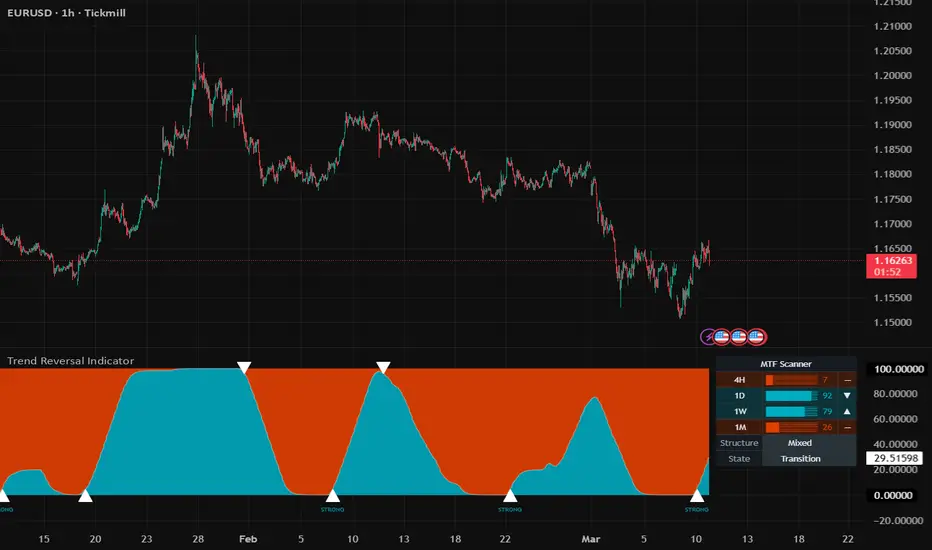
The Trend Reversal Indicator (TRI) is designed to help you recognize when a directional move may be getting stretched. Rather than forecasting direction, it looks at persistence — how consistently price holds above or below a volatility-adjusted baseline — and maps that behavior into a bounded oscillator.
What it measures
TRI evaluates sustained directional pressure relative to an adaptive reference. That reference combines a moving average of price with a confirmation band based on volatility. The indicator then counts how many bars remain beyond that band. That persistence score is converted to a 0–100 oscillator and smoothed to reduce short-term noise. High readings reflect persistent bullish pressure, low readings reflect persistent bearish pressure, and extremes suggest unusually prolonged activity.
How to read it
Interpretation centers on two reversal zones: an upper zone linked to potential bearish exhaustion and a lower zone linked to potential bullish exhaustion. Simply entering a zone is not a signal. TRI waits until the extreme has persisted long enough and the oscillator begins to turn, with optional structural and momentum filters and minimum spacing between signals. Higher-scoring signals, based on depth, persistence, and strength of the turn, can be labeled Strong. An integrated scanner adds context by showing oscillator level, momentum direction, and structural bias across higher timeframes.
A A worked example
Imagine price climbs steadily for an extended period while the oscillator holds inside its upper reversal zone. No marker appears during the climb itself. After several more bars, the oscillator starts curling down while still reflecting prior persistence. At that point, TRI might plot a bearish marker. A trader would then check price behavior around that area and look at the multi-timeframe panel to see whether higher timeframes also show extended bullish pressure or already show fading momentum.
Practical setup
Start with Trading Profile and Market Speed to match your approach: Conservative gives fewer, more selective markers, Balanced is the default, and Aggressive increases frequency. Custom unlocks manual tuning of baseline responsiveness, smoothing, and how long extremes must persist. Under Signal Controls you can choose long, short, or both directions, require strong extremes, and toggle arrows and Strong labels. Market Filters let you require trend alignment and confirmation that oscillator momentum is turning. Reversal Levels and the MTF scanner display can be adjusted, and the tool can be applied across forex, crypto, indices, commodities, and stocks.
Important limitations
TRI is a decision-support tool for discretionary analysis, not an automated system. It does not execute trades or provide financial advice. Extended pressure can continue even after exhaustion structures appear, so signals should be interpreted alongside price action and independent risk management.
For the related pressure visualization without this signal workflow, see the Trend Reversal Oscillator MTF guide.
Platform and source
This guide describes the published TradingView edition. MetaTrader controls and chart appearance may differ; use the instructions included with that build.
Original MQLSoftware publication and current TradingView access. Guide reviewed against the public product description on 13 September 2026. Examples are illustrative, not performance results.