“London takes out the Asia range.” “The New York sweep reverses.” Session folklore is everywhere — and almost none of it comes with a number attached. Session Liquidity Architecture, a free open-source TradingView indicator by [MQLSoftware], turns those claims into counted events on the exact chart you trade: how often London actually sweeps the Asia High here, and how often price closes back inside after the sweep — each with its sample size.
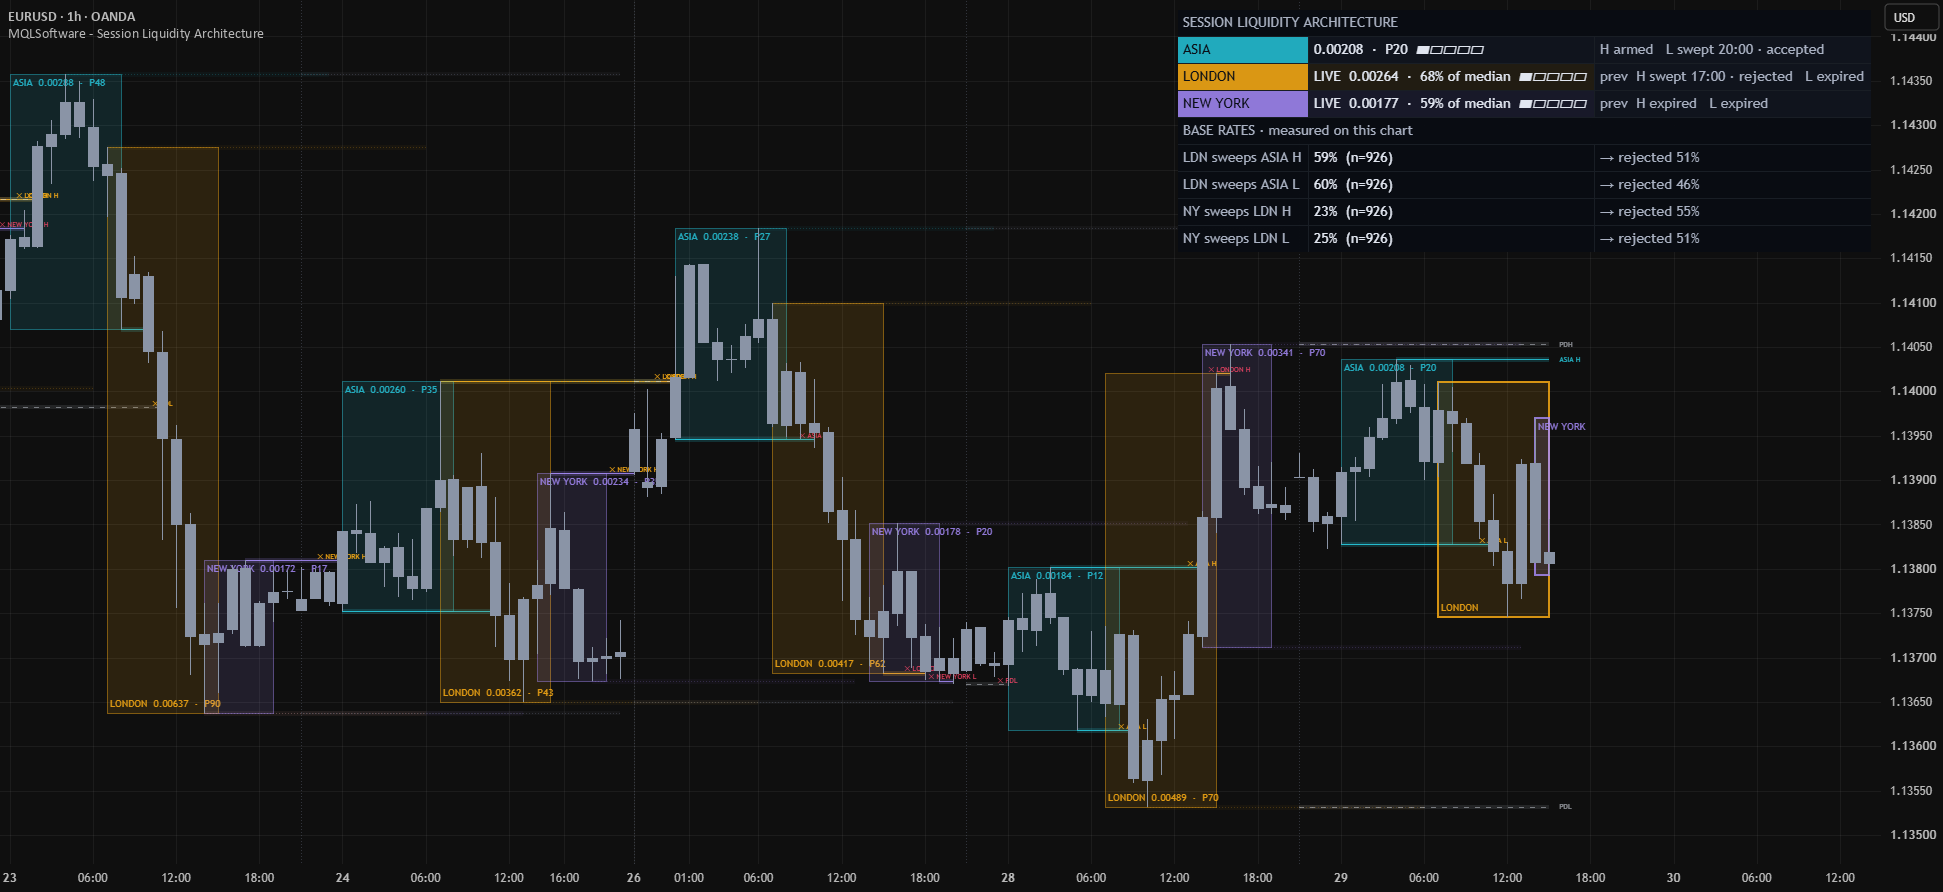
Most session tools draw boxes and stop
Boxes tell you where a session traded. They don’t tell you whether this session is unusually large for itself, whether that high sitting above price tends to get swept, or what usually happens after the sweep. Those are measurement questions, and this indicator treats the session map as a measurement problem — three mechanisms on top of the session-box base.
1. Session ranges ranked against their own history
Every completed session range is ranked as a percentile of that session’s own trailing distribution — a completed London box reads “LONDON 0.00421 · P63”. The active session shows a live read: current range, % of its median, and the percentile it has already reached. No pip thresholds, no per-market tuning: “big” and “quiet” are defined by the instrument’s own recent behavior, so the model works identically on FX majors, indices, or crypto.
2. Levels with a lifecycle, not static lines
Each session’s High and Low arm at session close and are tracked through explicit states: armed → swept → rejected or accepted. A sweep only registers on a confirmed bar — the first confirmed break of an armed level while a later session is active — and it counts as rejected when the sweep bar closes back inside the level. Levels that survive untouched until the next same-session open are marked expired. Previous Day High and Low run through the same machine. Because every transition happens on confirmed bars, the sweep history drawn on your chart is exactly the history the statistics are built from.
3. Base rates instead of narratives
The panel reports observed frequencies from the loaded history: London sweeps of the Asia High and Low, New York sweeps of the London extremes, and the post-sweep rejection rate for each — all with n printed next to the number. Below a minimum sample it says collecting instead of quoting a percentage.
An honest warning about what you’ll find: on some instruments the measured frequencies are strongly asymmetric and genuinely interesting; on others — 24/7 crypto especially — they hover near a coin flip, and the panel will show you that too. Replacing assumption with measurement sometimes means finding out the assumption was noise. That’s a feature.
Practical read
A common workflow: check the live session’s percentile (is this expansion or chop for this session?), see which armed levels sit above and below price, let a sweep resolve to rejected or accepted on the confirmed bar, and weigh what you see against this chart’s own base rates — then combine with your existing analysis and risk management. It pairs naturally with the volume profile’s node verdicts and the pullback resume rates from the same line of tools.
FAQ
Is it free?
Yes — free and open-source on TradingView (MPL-2.0).
Does it repaint?
Sweep events, rejection reads, counters and all alerts fire on confirmed bars only. The live session’s box, range and percentile update intrabar while the session is open — visual context, not signals; no security() calls, no lookahead.
Do I have to configure sessions for my timezone?
The three sessions (Asia, London, New York) take per-session IANA timezones, so daylight-saving shifts are handled automatically. Defaults work out of the box.
Where is the full guide?
Settings walkthrough, alert setup and worked examples live in the MQLSoftware account area — free with registration.
TradingView video walkthrough
Does London Really Sweep Asia? This Free Indicator Measures It
Watch on YouTube. This video shows TradingView; installation in MetaTrader follows the ZIP instructions.