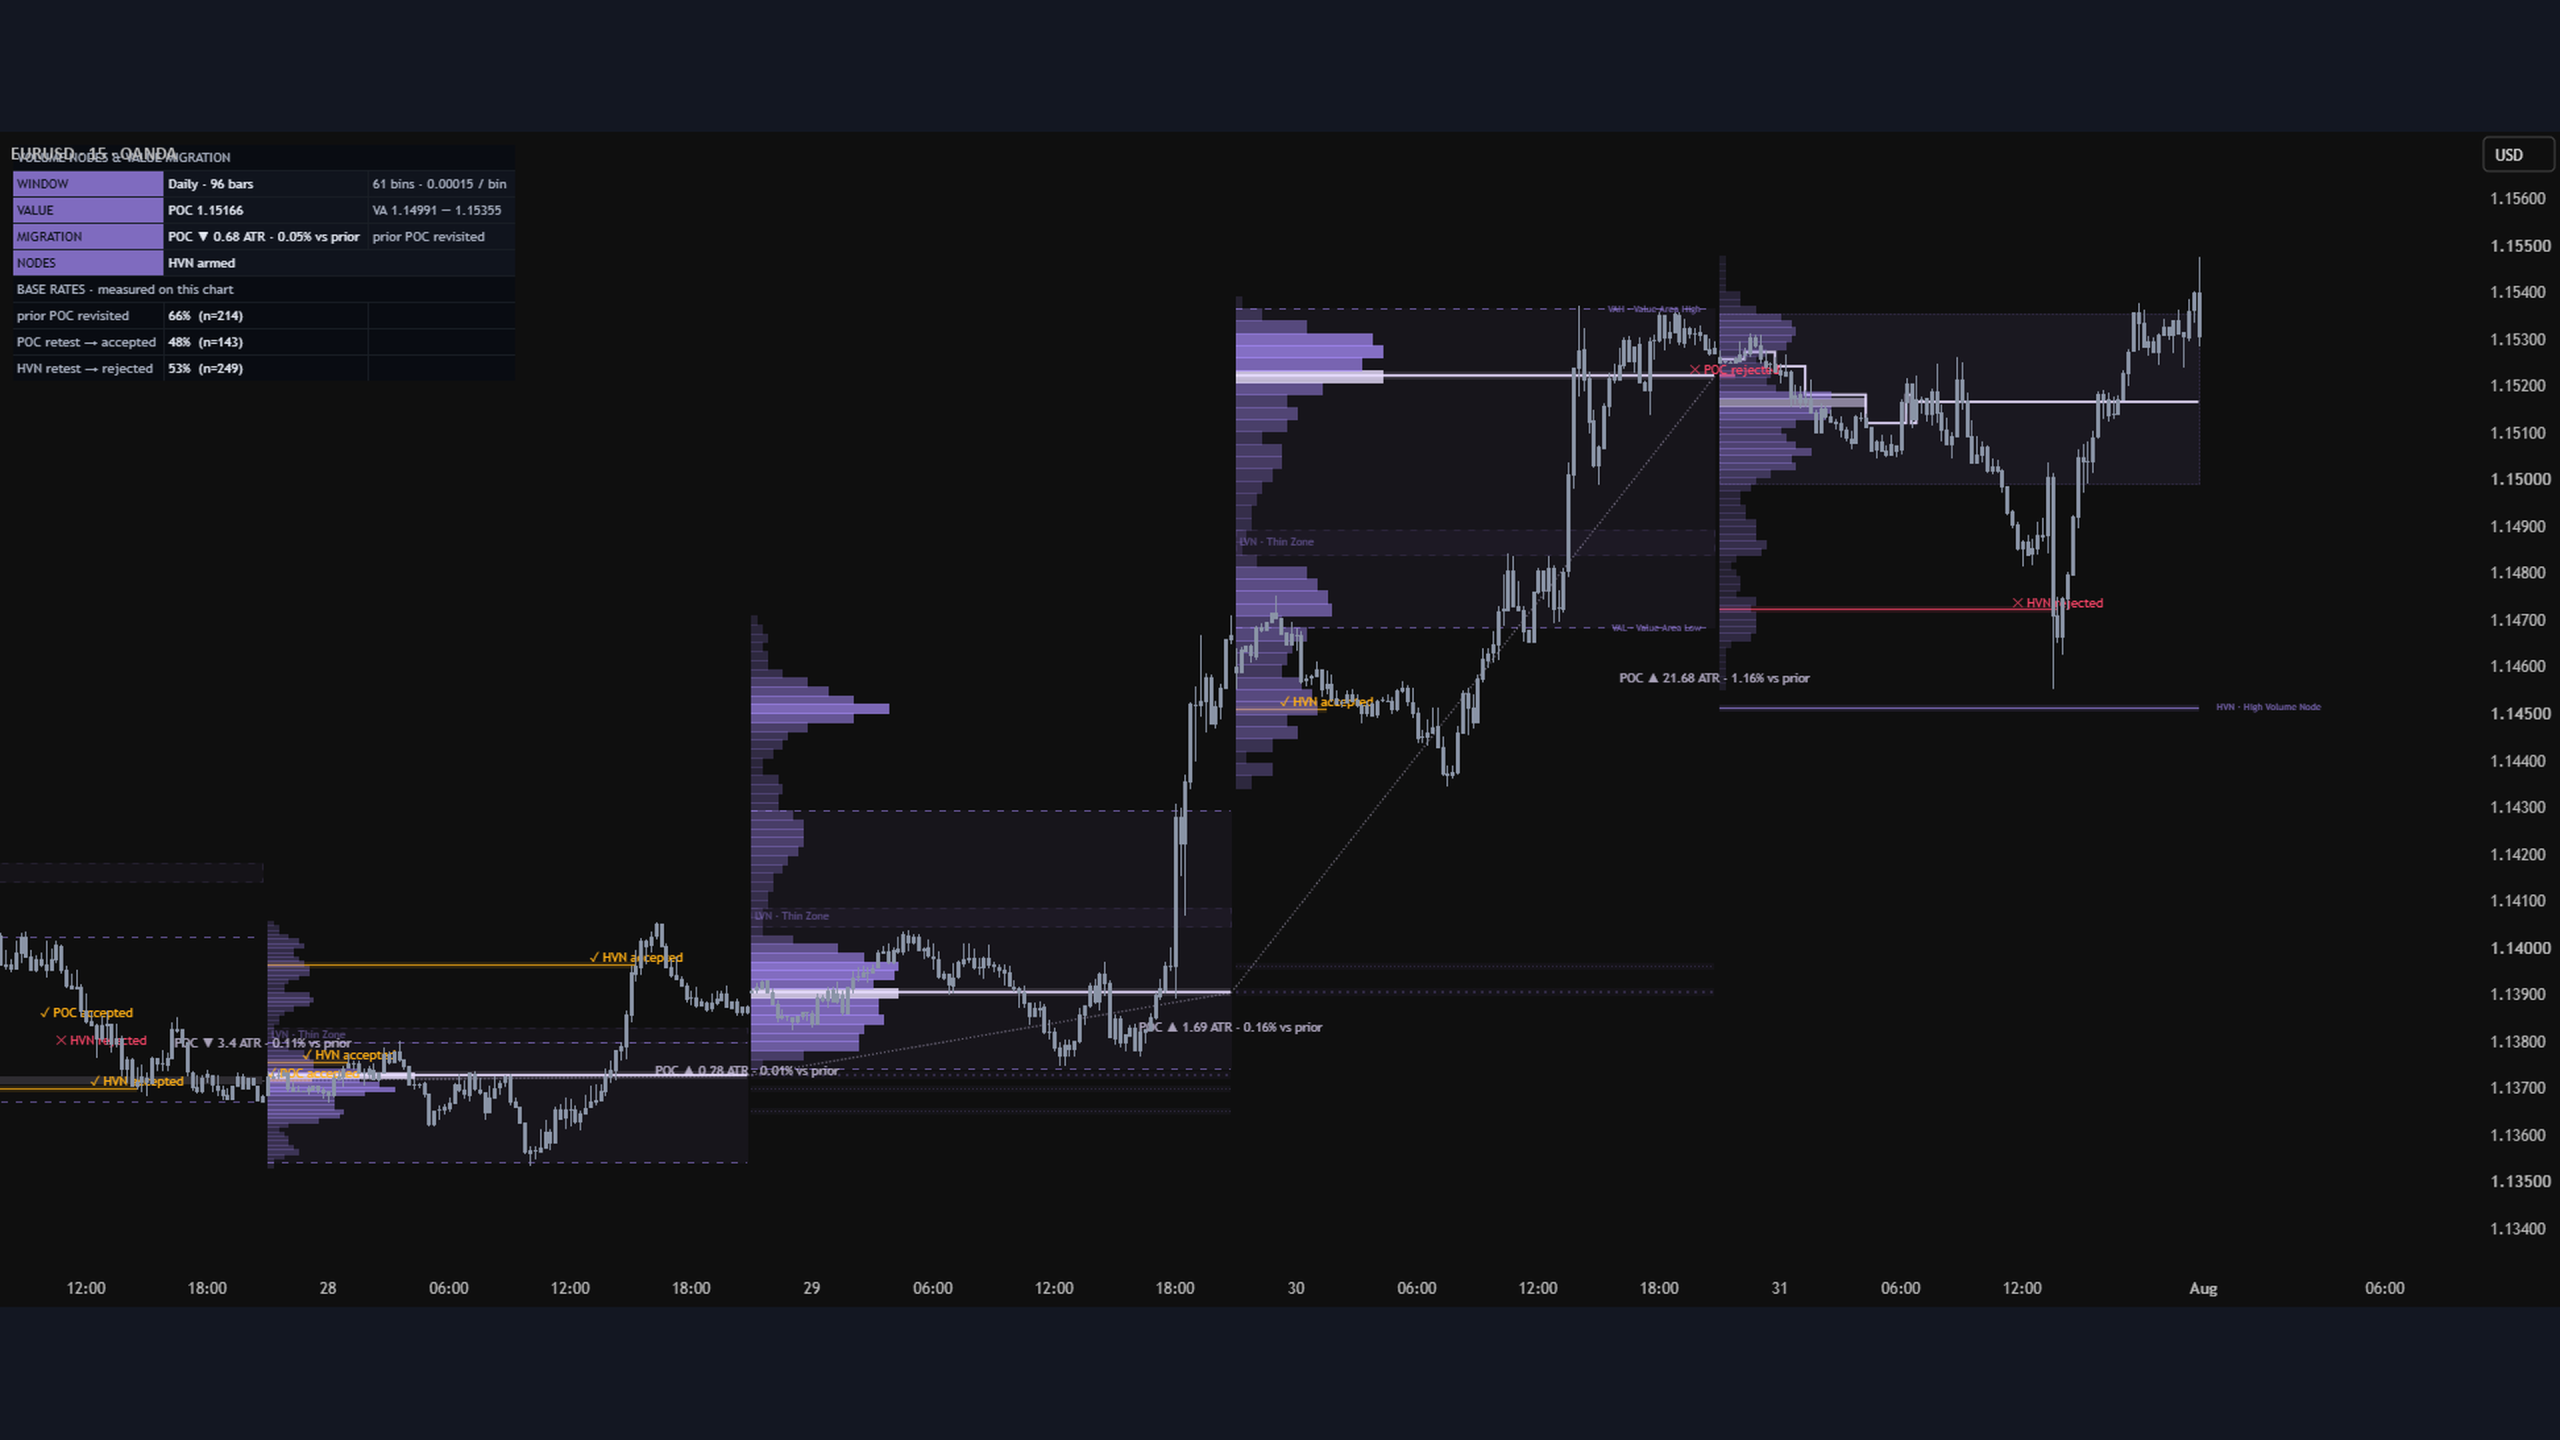
Here is a number your chart doesn’t show you: on EURUSD, measured across 214 consecutive daily profiles, price traded back through the prior day’s Point of Control on 66% of days. That sounds like a tradable magnet — until you see the second number. Only 48% of those retests were accepted: price held inside the level’s zone long enough to count. The rest were turned away or passed straight through.
Every volume profile tool will draw you the level. Almost none of them will tell you what happened the last two hundred times price came back to one. Volume Nodes & Value Migration — a free, open-source indicator for TradingView by [MQLSoftware] — was built to close that gap: it constructs the profile, arms the levels the profile produces, and then grades every single retest as accepted or rejected, keeping honest counts on your own chart’s history.
Why most volume profiles stop half a step too early
The standard construction, repeated across most built-in and community tools, looks like this: pick a fixed number of rows, spread each bar’s volume evenly across its high-low range, and hand the reader a static histogram. Three things go wrong quietly:
- A fixed row count means the resolution is arbitrary. The same 24 rows on a quiet Asian session and on a CPI-day expansion produce profiles that aren’t structurally comparable — on the same instrument, same week.
- Uniform spreading treats wicks like conviction. A bar that spiked to a high and settled far below it deposits just as much volume at the wick extreme as at the settled price. The histogram remembers the panic, not the agreement.
- A static histogram has no memory of outcomes. It shows where volume was, and stays silent on the only operational question: when price returns to this level, what usually happens?
Each of those is fixable, and fixing them changes what the tool is: from a picture into a measurement instrument.
Bin height that adapts to the market’s own scale
Instead of a fixed row count, the height of every volume bin is derived from ATR at the moment the window opens — roughly a quarter of an ATR per bin on the default setting, with coarser and finer options. A compressed range window and a trending expansion window both get profiles with comparable structure, on any symbol and any timeframe, with nothing to re-tune per market. If a window’s range outgrows the internal cap, bins merge two-into-one and the height doubles, so resolution stays bounded by construction rather than by luck.
Volume weighted toward where the bar actually settled
Each bar’s volume is distributed across its range by a triangular kernel with its peak at the close. The intuition: the close is the price the market agreed to leave the bar at; the wick tips are prices it explicitly refused. A profile built this way concentrates volume where business was actually done, which sharpens both the Point of Control and the shape of the high-volume nodes around it.
Watching value migrate, not just where it ended up
While a window is open, its Point of Control and Value Area are recomputed on every confirmed bar. The POC draws as a step-trail and the Value Area as a developing band — so you see value ladder directionally, or refuse to move and build in place, while it happens. When the window closes, the trail retires and the final POC / VAH / VAL lines stay. Consecutive windows are chained with dotted links labelled with the migration distance — in ATR units and in percent — so “value shifted 21.7 ATR higher between windows” is a thing you read off the chart, not estimate by eye.
The part that grades itself
When a window commits, its Point of Control and strongest high-volume nodes arm as horizontal levels — and from that moment every return is tracked by a state machine that runs on confirmed bars only:
- Accepted — price prints the required number of consecutive confirmed closes inside the node’s zone. The market came back and did business there.
- Rejected — price probes through the node’s center but closes outside the zone. The market looked and refused.
- A shallow graze of the zone’s edge resolves nothing — no verdict is invented where the market didn’t give one.
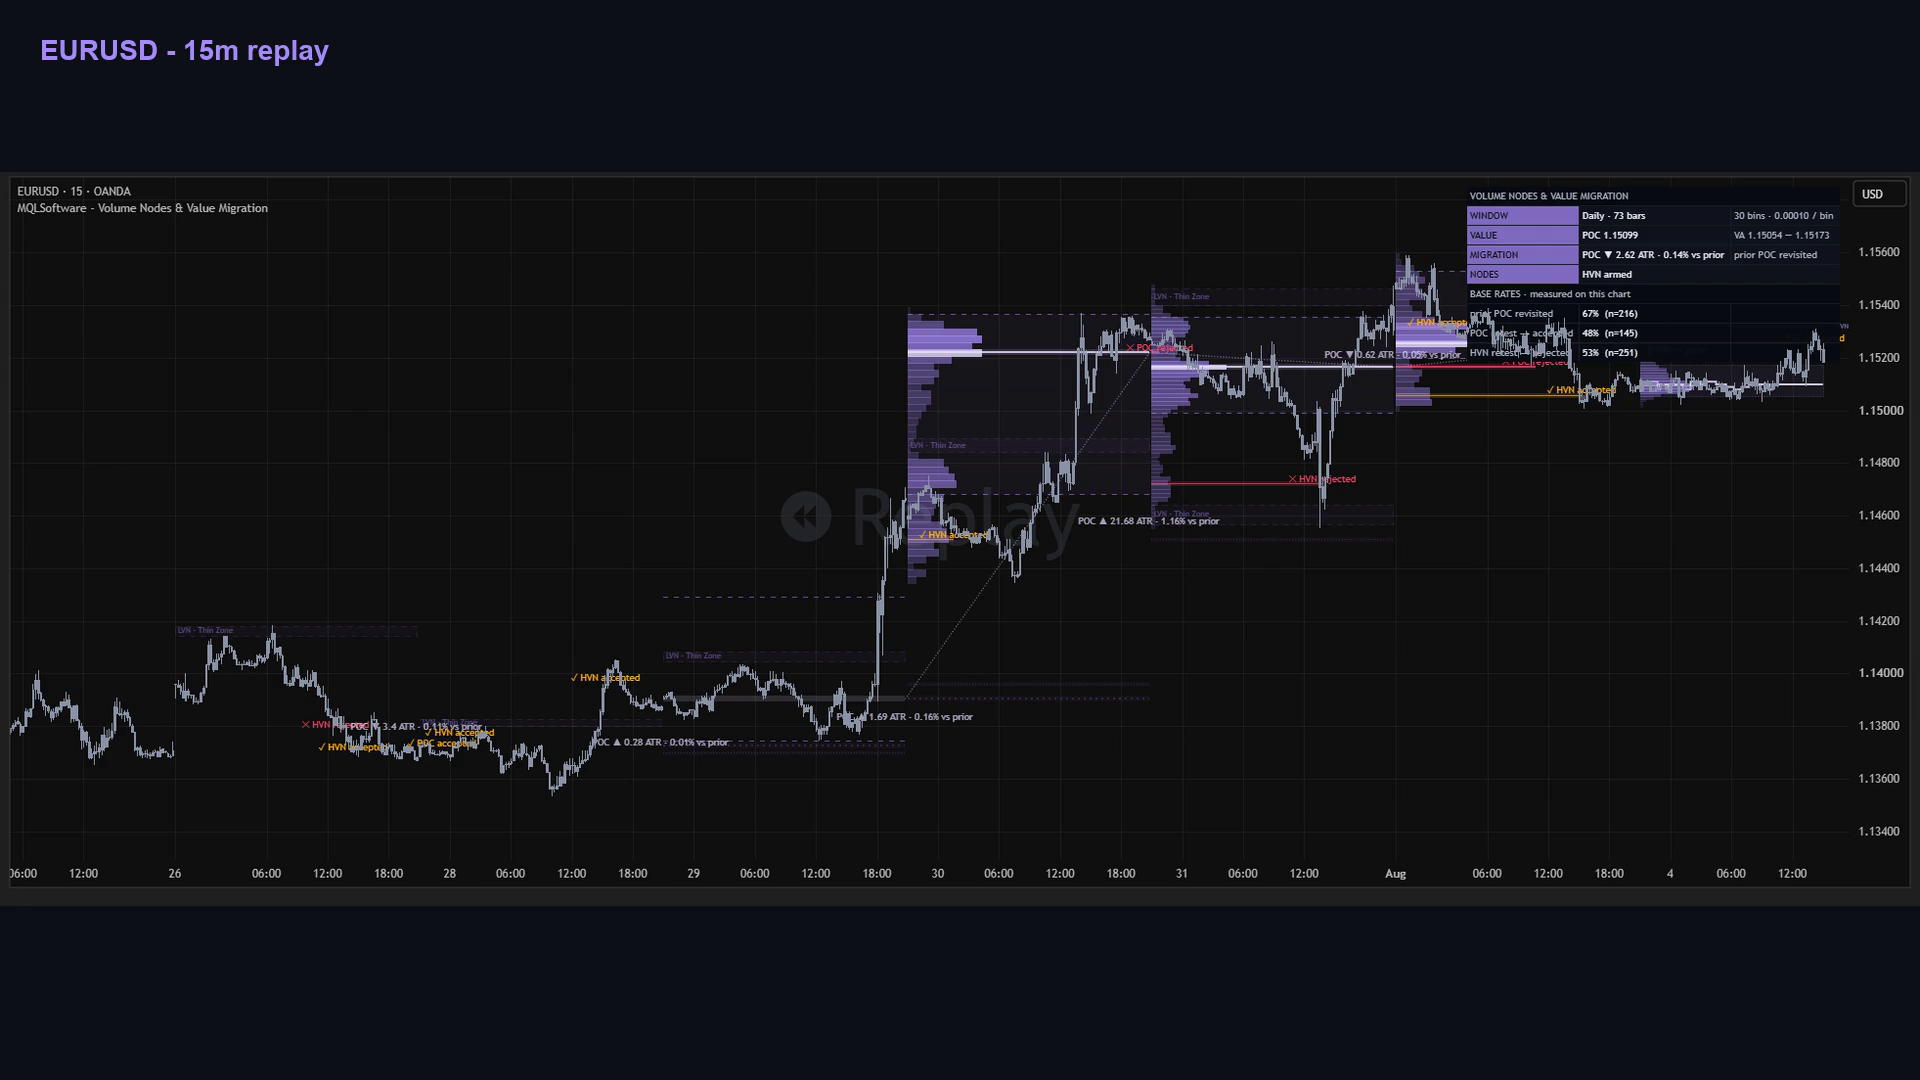
Every resolution is latched: a ✓ or ✕ printed on your chart cannot un-happen if price wanders back later. And because all of it — accumulation, node transitions, alerts — evaluates on closed bars, the marks appear exactly when a bar closes and never repaint. We verified this the boring way, stepping through TradingView’s Bar Replay: fifteen-plus intrabar updates inside a single bar produced zero changes to any mark or counter; everything resolved atomically on the close.
Base rates instead of folklore
The statistics panel keeps score from your chart’s own loaded history: how often the prior window’s POC got revisited, how often POC retests resolved as accepted, and how often HVN retests were rejected — each number with its sample size printed next to it. Below ten observations the panel says collecting instead of quoting noise.
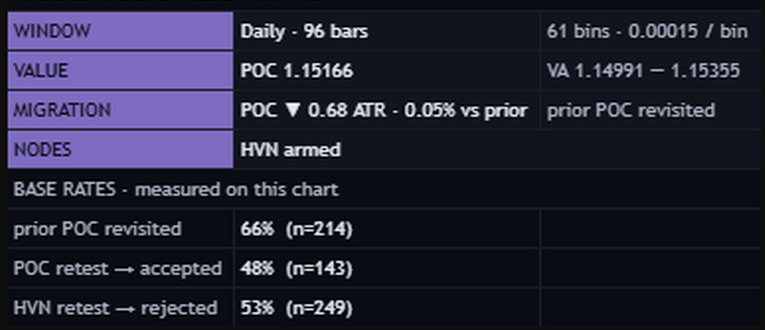
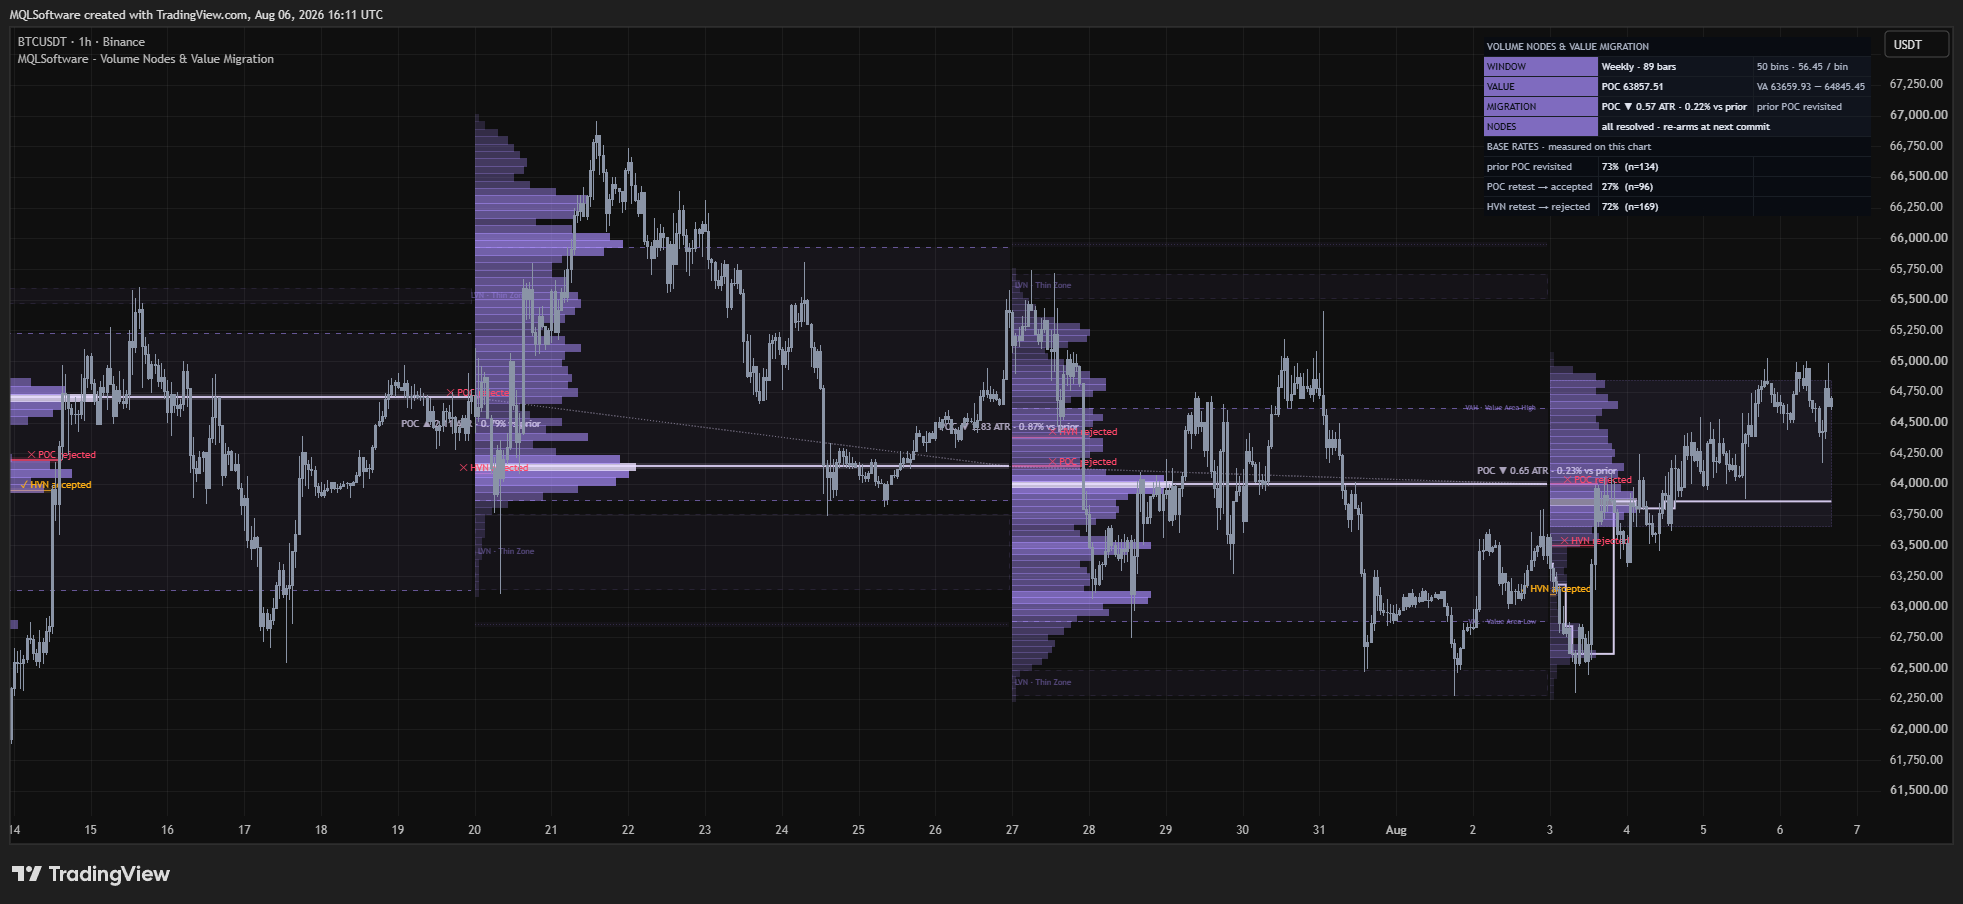
The numbers differ by instrument, timeframe and window size — which is precisely the point. On the EURUSD 15-minute chart above (daily windows), POC retests were accepted 48% of the time (n=143). On BTCUSDT 1h with weekly windows, the same engine measured 73% prior-POC revisits (n=134) but only 27% of POC retests accepted (n=96) — the level gets reached far more often and holds far less. These are observed frequencies with no claim attached; the value is that they’re your chart’s frequencies, not a number somebody quoted in a forum thread in 2019.
FAQ
Is it really free?
Yes — free and open-source on TradingView, Mozilla Public License. Add it to any chart from the public script page. No paywall on the indicator itself.
Does it repaint?
No. Node resolutions, counters and alerts run on confirmed bars only, and committed profiles are built exclusively from closed windows and never recalculated. The developing trail of the current window updates as the window grows — that’s visual context for a forming profile, clearly separated from the latched verdicts.
Does it work on symbols without volume data?
Yes, with a caveat it states openly: on feeds that supply no volume the profile weights every bar equally (a time-at-price read), and the panel says so. For crypto, prefer exchange feeds that report volume.
What about higher-timeframe data — any lookahead risk?
None by construction: the script makes zero request.security calls. Window anchors are detected in the chart’s own context.
Where do the alerts fit?
Four confirmed-bar alerts ship with it: node accepted, node rejected, profile committed, prior POC revisited. Setting them up per symbol — and the settings walkthrough, presets and workflow examples — live in the full guide in the free account area.
See it move
The 90-second walkthrough below shows the whole loop on a live chart — the profile building, value migrating, and a node resolving on bar close in replay. A short summary with chapters is on the video page.
Download for MetaTrader 4 and 5
Download free MT4 + MT5 ZIP — no registration
Includes compiled indicators, installation instructions and available templates for Windows desktop MetaTrader. Extract the archive and follow INSTALL.txt. Enable DLL imports only for the trusted MQLSoftware indicator: it uses the Windows internet library for activation. No separate DLL is included.
Fresh builds are generated daily. This build: 5 October 2026 01:00 UTC; valid until 5 November 2026 01:00 UTC (31 days from build time). Downloading or sharing an older archive does not restart its term. Online activation and periodic checks are required. You may share or mirror the original ZIP unchanged, including its instructions. Return to this page for current builds.
ZIP size: 218695 bytes. SHA-256: Verify your download
f91c817d6f45fabc85cceb0fd31ac80e3feac3f52c108005e45f80cef8e0e834