When a key price level breaks on a chart, the useful question is not only whether price crossed it. It is also: what was the observable participation context behind that confirmed break? A fast, direct leg and a hesitant, uneven leg can both finish beyond the same swing level, yet the path to that close was not the same.
Structure Participation Matrix [MQLSoftware] is a free, open-source TradingView overlay that turns each confirmed structure break into a frozen, inspectable record. It measures four disclosed features of the completed leg, combines them into a fixed score bucket, and checks one neutral endpoint after a fixed number of confirmed bars. It does not create entries, stops, targets, position sizes, execution instructions, or forecasts.
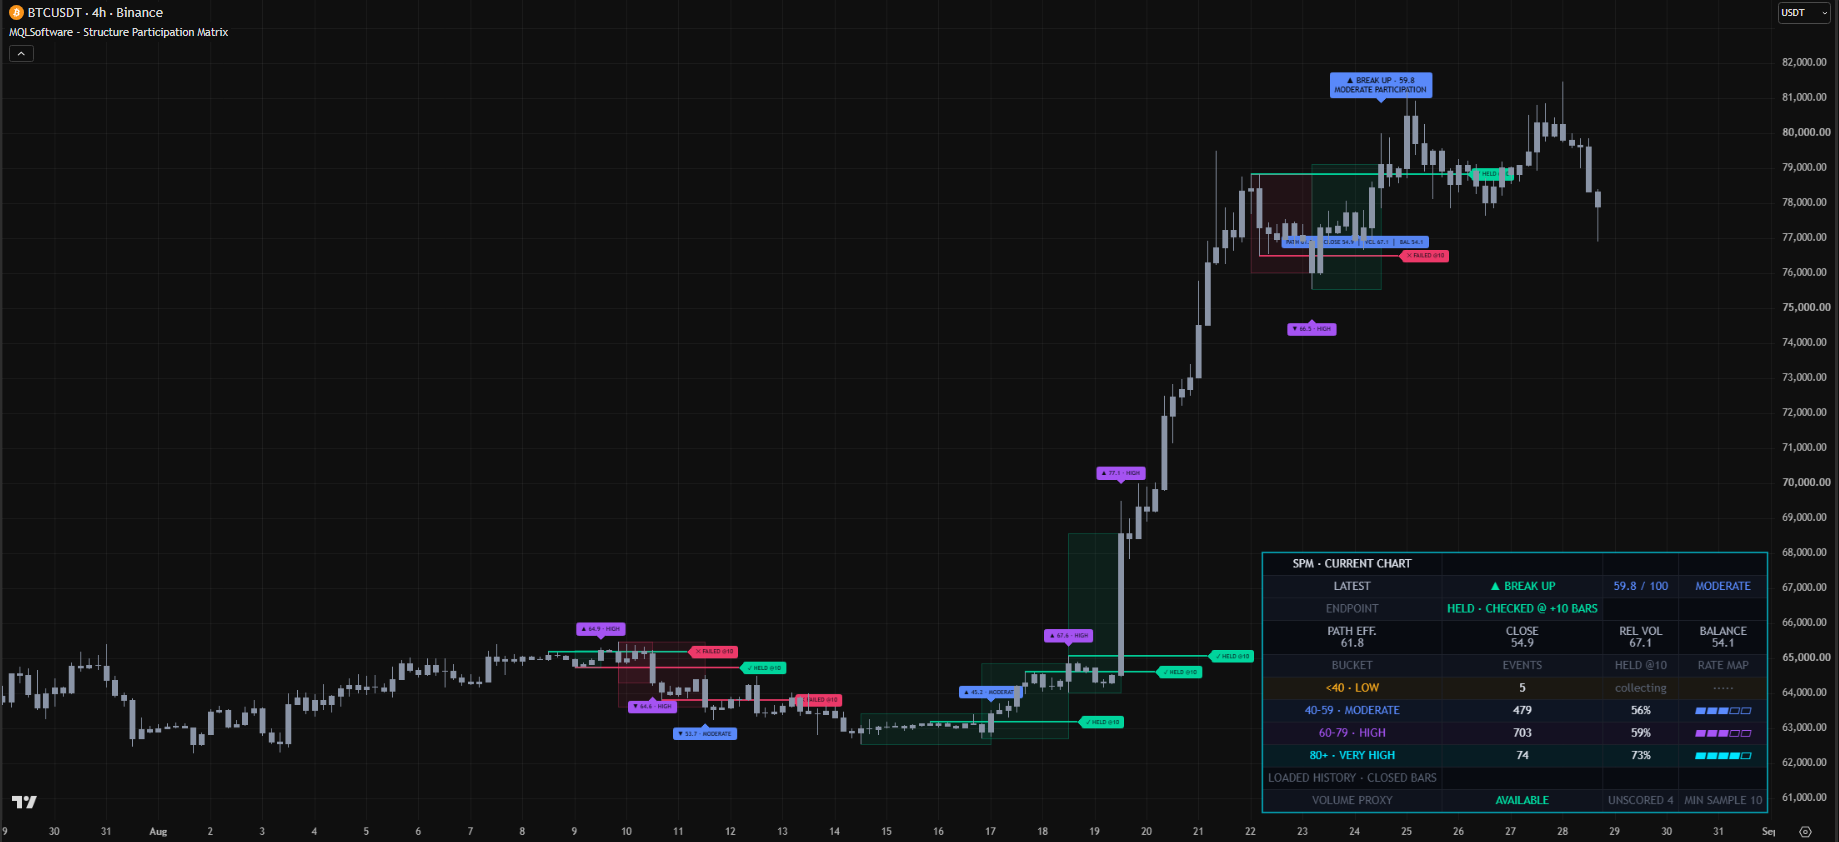
First, the break itself must be confirmed
The indicator starts with strict symmetric swing points. A high or low must be a unique extreme on both sides of the candidate bar; equal highs or equal lows are rejected. The level does not become eligible until the complete right-side confirmation window has closed. This delay is deliberate: the script does not pretend that a pivot was knowable before the bars needed to confirm it existed.
Once armed, the swing is broken only by a confirmed close beyond the level plus the selected ATR buffer. A wick through the level is not a break event. The break label is placed on the actual break bar without a negative offset, so the visual marker is not back-plotted onto an earlier candle.
This confirmed-bar model is narrower than a general claim that every drawing is static. The latest panel can render on the last chart bar, but breaks, frozen values, score buckets, outcomes, counters, markers, and alert flags change only inside the closed-bar state machine. For a broader explanation of that distinction, see what non-repainting does — and does not — tell you.
Four readings freeze at the break close
For a scored event, the completed structural leg becomes a four-part ledger. Each component is normalized to a 0–100 reading and frozen when the break closes:
- PATH EFF. compares net displacement with the total bar-to-bar path of the leg. A direct move scores differently from a leg that covered similar net distance through more back-and-forth travel.
- CLOSE summarizes directional close location over the final part of the leg. It describes where those closes sat inside their bars; it is not a prediction about the next close.
- REL VOL compares average chart-reported volume across the leg with a rolling median baseline. On markets that report tick volume, that is the data being compared.
- BALANCE weights chart volume by directional close location. It is an OHLCV proxy, not a reconstruction of transactions inside the candle.
Those limitations matter. REL VOL and BALANCE are not bid/ask delta, order flow, footprint data, or proof of institutional activity. They cannot identify who participated. Their job is smaller and auditable: describe the price-and-chart-volume context available to the script at the confirmed break.
One public formula, one frozen score
The composite is deliberately transparent:
30% × PATH + 25% × CLOSE + 25% × REL VOL + 20% × BALANCE
The result is normalized once to the nearest tenth and then reused everywhere — in the event label, color, quality text, bucket, matrix record, and score-based alert. That single source prevents the panel from displaying one boundary while the event logic acts on another.
The four buckets are <40, 40–59, 60–79, and 80+. Their labels — LOW, MODERATE, HIGH, and VERY HIGH — classify the frozen participation score, not the quality of a trade and not the probability of a future move. A HIGH event can later receive either endpoint observation, just as a LOW event can. The matrix exists to preserve that distinction rather than hide it behind one headline number.
UNSCORED is a data-quality result, not a missing signal
The script does not manufacture a score when the required history or volume is incomplete. Every bar in the measured leg must have valid reported or tick volume. The leg must also fit inside the configured maximum measured-history window. If either requirement fails, the confirmed break stays visible as UNSCORED, but it is excluded from bucket counts and rates.
That treatment is important when comparing symbols. Volume availability varies by feed, and the history loaded on a TradingView chart is not identical in every session or plan. An explicit UNSCORED event tells you the measurement could not be supported by the available inputs; it should not be silently treated as zero participation or folded into the sample.
HELD @N and FAILED @N are endpoint observations
After exactly the configured number of confirmed bars, each scored break is checked once. If the endpoint close remains beyond the broken level, the record becomes HELD @N. If it is no longer beyond that level, it becomes FAILED @N. The result is then fixed.
This language does not describe a trade outcome. HELD does not mean price stayed beyond the level throughout the entire window, reached a target, or produced a profitable setup. It means only that one later close was still on the broken side. FAILED likewise means the endpoint was not beyond the level; it is not a stop-out label.
This endpoint design keeps the observation reproducible. Instead of choosing a favorable excursion after the fact, the script uses one disclosed horizon and one disclosed comparison.
How to read the panel without turning it into a forecast
Read the display from top to bottom:
- LATEST gives the direction, frozen score, and score-band label for the newest event.
- ENDPOINT says whether that event is still pending or has received its one HELD/FAILED check.
- PATH, CLOSE, REL VOL, BALANCE expose the four components behind the composite, so a similar total score can still be understood through a different component mix.
- BUCKET / EVENTS / HELD @N / RATE MAP aggregate resolved events by their frozen score bucket.
- VOLUME PROXY / UNSCORED / MIN SAMPLE show whether usable volume exists, how many breaks were excluded, and when the panel is allowed to replace
collectingwith a rate.
The minimum-sample gate prevents a percentage from appearing before a bucket contains the configured number of resolved events. Even after the gate opens, the rate remains a historical description of the chart history currently loaded. Change the symbol, timeframe, inputs, or history boundary and the sample can change. It is not a forward estimate or a win rate.
For a reproducible screenshot-comparison checklist, read Why Loaded History Changes the Matrix.
For another structural lens focused on impulse, correction, and invalidation rather than participation scoring, read BOS vs CHoCH: what structural invalidation actually changes.
Settings that change the question
Start with defaults, then change one assumption at a time:
- Strict Swing Strength changes both sides of the pivot test and its confirmation delay.
- Break Buffer (ATR) changes how far a confirmed close must travel beyond the armed swing.
- Maximum Measured Leg Bars limits how far back the component engine may reach; an overlong leg can still produce a visible UNSCORED break.
- Final Close Window and Volume Median Baseline change two measurement windows, not a trading threshold.
- Outcome Window chooses the fixed N-bar endpoint.
- Minimum Sample to Display controls when bucket rates leave
collecting.
Visual switches — levels, labels, rails, leg shading, outcome markers, panel, and retained-event depth — affect drawings only. They do not remove historical events from the calculation ledger or change alert flags. This makes it possible to simplify the chart without changing the question being measured.
Alerts stay tied to closed-bar events
Available alert conditions cover any confirmed break, break direction, a frozen score of 60 or higher, and the delayed HELD or FAILED endpoint. Each reads the same one-bar event flag used by the chart state. Set TradingView alerts to Once Per Bar Close so the platform cadence matches the indicator’s confirmed-bar contract.
You can inspect the complete source and add the indicator from its free open-source TradingView page. Because the formula and event rules are public, each label can be traced back to the same disclosed measurements shown on the chart.
FAQ
Does Structure Participation Matrix predict whether a breakout will continue?
No. It records observable context at a confirmed break and one later endpoint. Historical bucket
observations are not future probabilities.
Is REL VOL real volume?
It uses the volume reported by the current chart feed. On many markets that is tick volume. The
indicator does not claim bid/ask delta, footprint data, or participant identity.
Why did a confirmed break show UNSCORED?
The measured leg lacked valid volume on at least one bar or exceeded the configured history bound.
The break remains visible, but it is excluded from bucket statistics.
Does HELD @10 mean price held for all ten bars?
No. With an outcome window of ten, it means the close at that one ten-bar endpoint was beyond the
broken level. Price may have crossed the level during the interval.
Does hiding labels or old drawings change the matrix?
No. Display toggles and retained drawing depth affect visual objects only; calculations, counters,
and event flags continue across the history loaded on the chart.
Download for MetaTrader 4 and 5
Download free MT4 + MT5 ZIP — no registration
Includes compiled indicators, installation instructions and available templates for Windows desktop MetaTrader. Extract the archive and follow INSTALL.txt. Enable DLL imports only for the trusted MQLSoftware indicator: it uses the Windows internet library for activation. No separate DLL is included.
Fresh builds are generated daily. This build: 23 October 2026 01:00 UTC; valid until 23 November 2026 01:00 UTC (31 days from build time). Downloading or sharing an older archive does not restart its term. Online activation and periodic checks are required. You may share or mirror the original ZIP unchanged, including its instructions. Return to this page for current builds.
ZIP size: 204740 bytes. SHA-256: Verify your download
37fb81c04a47844dc074f6559aadf9ebc1dc3848d610fc359e220d98da7cf26f
TradingView video walkthrough
How to Use Structure Participation Matrix — Full Chart Walkthrough
Watch on YouTube. This video shows TradingView; installation in MetaTrader follows the ZIP instructions.