Every pullback asks the same question: pause or reversal? Most oscillators answer it by pairing two generic indicators and letting you eyeball the divergence. Trend Integrity Oscillator — a free, open-source TradingView indicator by [MQLSoftware] — answers it by separating the two things that actually diverge in a pullback, trend efficiency and structural integrity, and then doing something most tools never do: it measures the outcome of every pullback on your chart and prints the rate on the marker.
On one EURUSD 1h chart, armed bull pullbacks resumed 53% of the time (n=91). On BTCUSD 1h, bear pullbacks resumed 59% (n=59). Different market, different number — and that’s the point: the rate is measured per chart, not asserted in a manual.
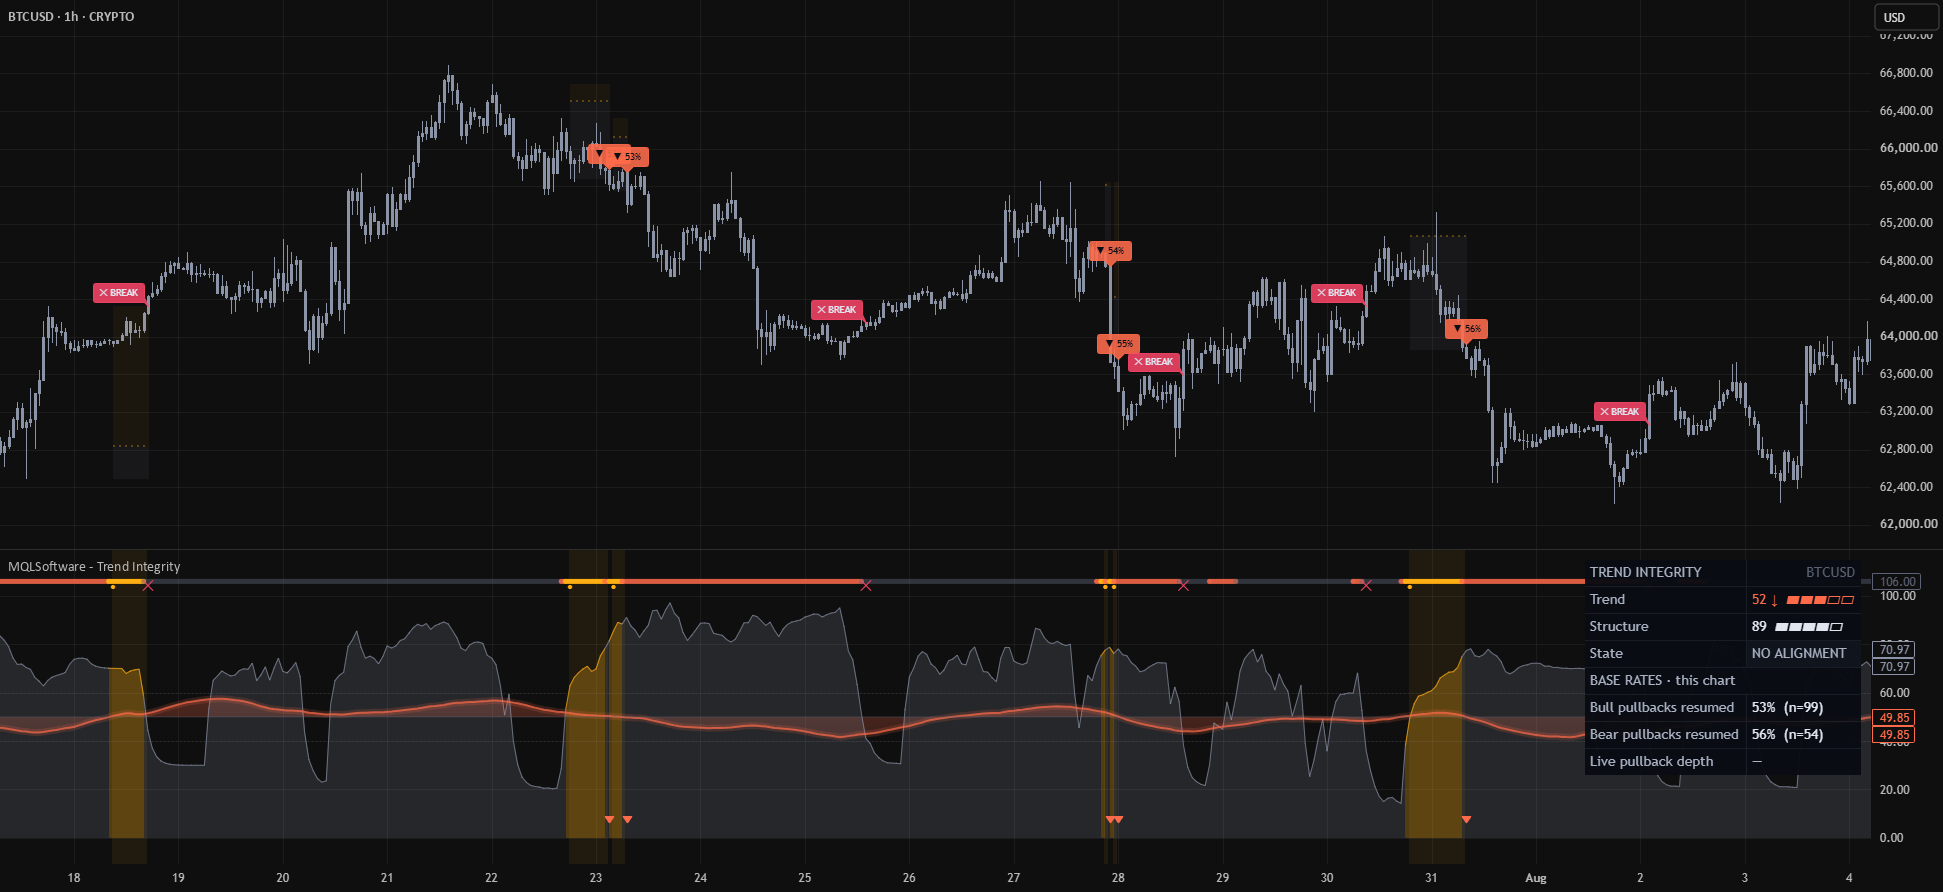
Two lines that measure different things
Trend Efficiency (0–100) is a multiscale signed efficiency ratio: sER(n) = (close − close[n]) / path(n). At +1 the last n bars traveled their entire path upward; at −1 downward; near 0, churn. Three horizons are blended — the chart window plus two senior windows equal in wall-clock time to auto-selected higher timeframes — with the seniors carrying most of the weight (0.5/0.3/0.2). Everything is computed straight on chart bars: the script contains zero request.security calls, so the whole class of higher-timeframe re-resolution bugs is structurally impossible.
Structure Integrity (0–100) is not a second oscillator. It’s a composite of three confirmed-pivot facts: how firmly price holds the structural anchor pivot (ATR-scaled), what share of recent pivot steps agree with the structural direction, and how deep the live pullback is — ranked as a percentile against the depths of pullbacks on this chart that eventually resumed. Self-calibrating, no fixed depth settings to tune.
In a healthy pullback the first line dips while the second holds. When both fall together, you’re usually not looking at a pullback anymore.
The state machine: armed → resumed or broken
The engine tracks explicit episodes on confirmed bars only:
- Armed — trend efficiency flips against the trend while the structure still holds. The pullback territory shades on the price chart, and the anchor pivot freezes for the episode.
- Resumed — efficiency recovers, or price prints a confirmed close beyond the pre-pullback extreme. A ▲/▼ marker prints on the chart with this chart’s measured resume rate for that direction on it (e.g. “▼ 59%”).
- Broken — a confirmed close through the anchor as it stood when the pullback started. That’s a reversal, not a pullback, and ✕ BREAK prints at the violated anchor.
A structural direction flip during an armed episode counts as a failed pullback — nothing is silently dropped, so the on-chart history and the statistics are the same history.
The Survival Zone
While a pullback is armed, the indicator draws the one line pullback traders keep trying to guess: the P75 depth of all pullbacks on this chart that eventually resumed. Between that line and the anchor is territory most survivors never visited — if price is spending time there, the pullback is statistically deeper than what this chart usually forgives. The zone is frozen at arm time, so it doesn’t slide around as the episode develops.
Measured base rates, not folklore
The panel keeps per-direction score from the chart’s own history: how often armed bull and bear pullbacks actually resumed, each with its sample size, plus the live pullback’s depth percentile. Below ten completed episodes it says collecting instead of quoting noise. These are observed frequencies with no claim attached — the same discipline as our volume profile that grades its own levels.
FAQ
Is it free?
Yes — free and open-source on TradingView (MPL-2.0). No paywall on the indicator.
Does it repaint?
No. State transitions, markers, counters and all five alerts fire on confirmed bars only, and a resolved episode is latched — a printed ▲/▼ or ✕ cannot un-happen. The live episode’s visuals (survival zone shading, integrity area) update as the episode develops; the verdicts don’t.
Why does it need no higher-timeframe data?
The senior horizons are expressed as bar counts equal in wall-clock time to the auto-selected higher timeframes, computed on the chart’s own bars. Same senior-weighted read, none of the request.security failure modes.
What are the alerts?
Pullback armed, pullback resumed, structure broken, direction flip, deep pullback (survival line crossed) — plus one dynamic alert naming the event. All confirmed-bar.
Where are the settings explained?
The full guide — every input, alert setup, and worked chart examples — is in the MQLSoftware account area, free with registration.
Download for MetaTrader 4 and 5
Download free MT4 + MT5 ZIP — no registration
Includes compiled indicators, installation instructions and available templates for Windows desktop MetaTrader. Extract the archive and follow INSTALL.txt. Enable DLL imports only for the trusted MQLSoftware indicator: it uses the Windows internet library for activation. No separate DLL is included.
Fresh builds are generated daily. This build: 5 October 2026 01:00 UTC; valid until 5 November 2026 01:00 UTC (31 days from build time). Downloading or sharing an older archive does not restart its term. Online activation and periodic checks are required. You may share or mirror the original ZIP unchanged, including its instructions. Return to this page for current builds.
ZIP size: 265979 bytes. SHA-256: Verify your download
8e5f9bdf089b4eb74dae03d0ab870ad8d19bbf522e94e950858ac33894a06191
TradingView video walkthrough
How to Use Trend Integrity Oscillator — Full Chart Walkthrough
Watch on YouTube. This video shows TradingView; installation in MetaTrader follows the ZIP instructions.