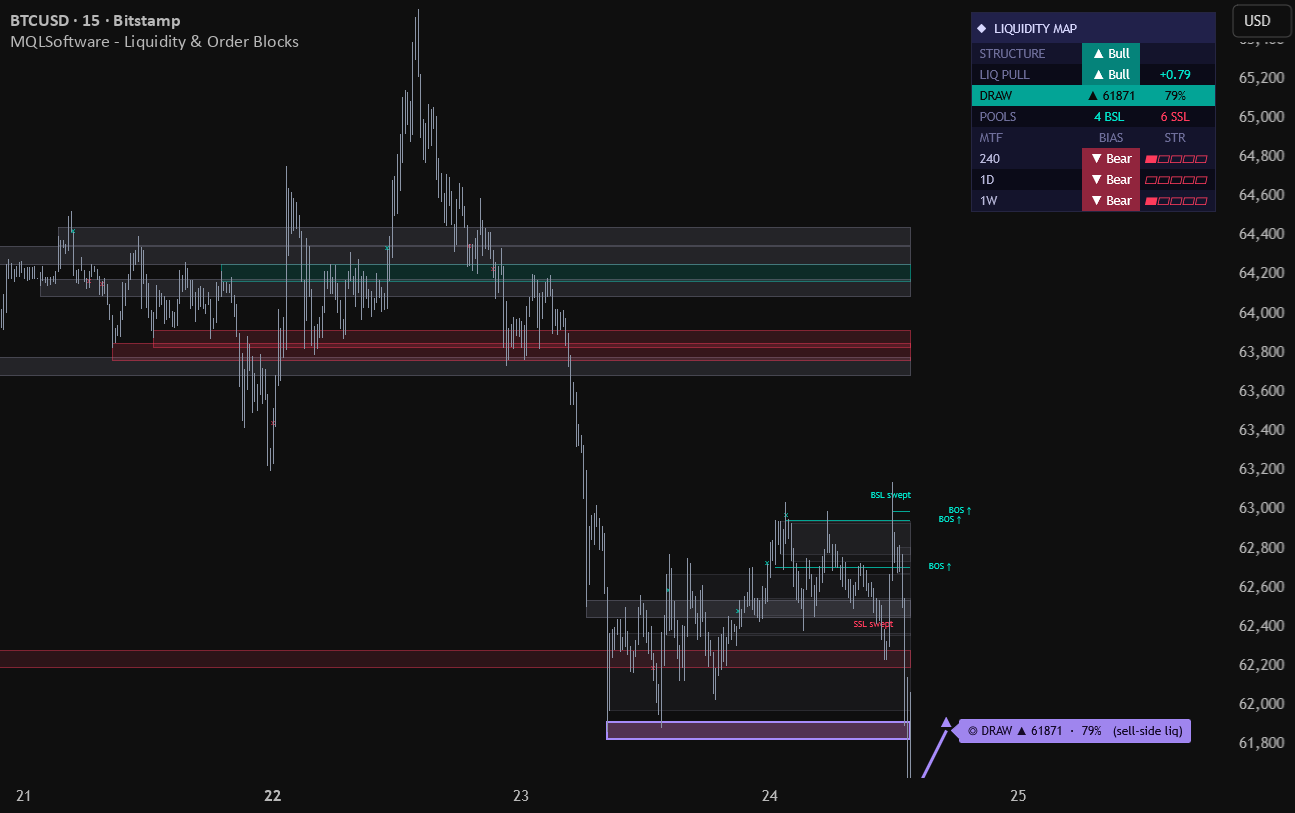
Most liquidity tools give you one of two things: a forest of equal-high/equal-low lines with no ranking, or structure labels with no opinion about where price is being pulled next. Liquidity Map & Order Blocks — a free, open-source TradingView indicator by [MQLSoftware] — does the missing third thing: it clusters swing levels into scored density bands, gates order blocks by structure, and projects the most likely draw on liquidity with a hit-rate measured from this chart’s own history.
Pools, not lines
Swing highs and lows are grouped along the price axis by a clustering pass whose merge distance scales with ATR — so equal-ish levels collapse into one pool instead of a stack of near-duplicate lines, and the behavior stays consistent from FX to crypto. Each pool carries a Liquidity Score built from a saturating touch count, an age-decay term, relative volume at the forming pivots, and rejection-wick depth. Band brightness follows the score: what you see is how heavy and how fresh the resting liquidity is, not just how many times a level was touched. Swept pools dim to grey — a hunted level is visually retired.
Draw on liquidity — with the confidence stated, not implied
Each unmitigated pool is treated as an attractor. Its pull is the product of its Liquidity Score, an exponential proximity kernel in ATR units, a structural prior favoring pools in the trend’s continuation direction, and a path-clearance term that discounts a pool when other strong pools sit between it and price. The strongest pull becomes the projected draw target — and when the model’s confidence is low, the arrow is deliberately thin and faded. A weak draw never dresses up as a strong one.
The hit-rate is measured, not asserted
The percentage on the draw label is not a fixed weight someone chose. Every draw is profiled into a bucket (score, distance, structural alignment), and the script records how often pools of that profile were actually reached within the horizon over the loaded history. The displayed figure is that bucket’s empirical reach frequency, smoothed with a weak prior and marked provisional (~NN% (n…)) while the sample is thin. It’s a descriptive statistic about the past of this chart — the same measured-not-asserted discipline as the volume profile’s node verdicts.
Structure-gated order blocks
Order blocks are drawn only when they originate a Break of Structure — the last opposite candle before the break — instead of marking every candle that vaguely qualifies. An optional Fair Value Gap layer marks three-candle imbalances aligned with the break. Both fade once mitigated, and mitigation is one-directional: once spent, marked as spent. Structure itself comes from a protected-swing state machine (BOS / CHoCH), with a plain-language label mode (Trend break / Reversal) if the acronyms aren’t your dialect.
Sweeps
A sweep marks a stop-hunt: a wick beyond the last significant swing that closes back within it. The two most recent are labelled in full; older ones compress to compact marks so a long history doesn’t bury the chart.
FAQ
Is it free?
Yes — free and open-source on TradingView. No paywall.
Does it repaint?
Confirmed pools, sweeps, structure breaks and order blocks are built from confirmed pivots and stay anchored; the newest swing is provisional until the right-bars delay passes (default 3 closed bars — a property of every pivot-based tool). The draw hit-rate is a learning statistic: it refines as more history is processed, which is not a repaint of historical bars. Panel data reads higher timeframes with lookahead_off + one-bar offset; alerts are confirmed-bar only.
Does it give buy/sell signals?
No. It maps liquidity and structure and states a measured reach frequency. It makes no claim about profitability, and the draw percentage describes the past, not the future.
Where’s the full guide?
Settings, alerts and worked examples — in the MQLSoftware account area, free with registration.
Download for MetaTrader 4 and 5
Download free MT4 + MT5 ZIP — no registration
Includes compiled indicators, installation instructions and available templates for Windows desktop MetaTrader. Extract the archive and follow INSTALL.txt. Enable DLL imports only for the trusted MQLSoftware indicator: it uses the Windows internet library for activation. No separate DLL is included.
Fresh builds are generated daily. This build: 5 October 2026 01:00 UTC; valid until 5 November 2026 01:00 UTC (31 days from build time). Downloading or sharing an older archive does not restart its term. Online activation and periodic checks are required. You may share or mirror the original ZIP unchanged, including its instructions. Return to this page for current builds.
ZIP size: 262085 bytes. SHA-256: Verify your download
f24879b3312cf68b10c5b1d2c954b2d688f04719ff8913fc055a9e9335159366
TradingView video walkthrough
This Free Indicator Scores Every Liquidity Pool Before It Draws Anything
Watch on YouTube. This video shows TradingView; installation in MetaTrader follows the ZIP instructions.